Fig. 25
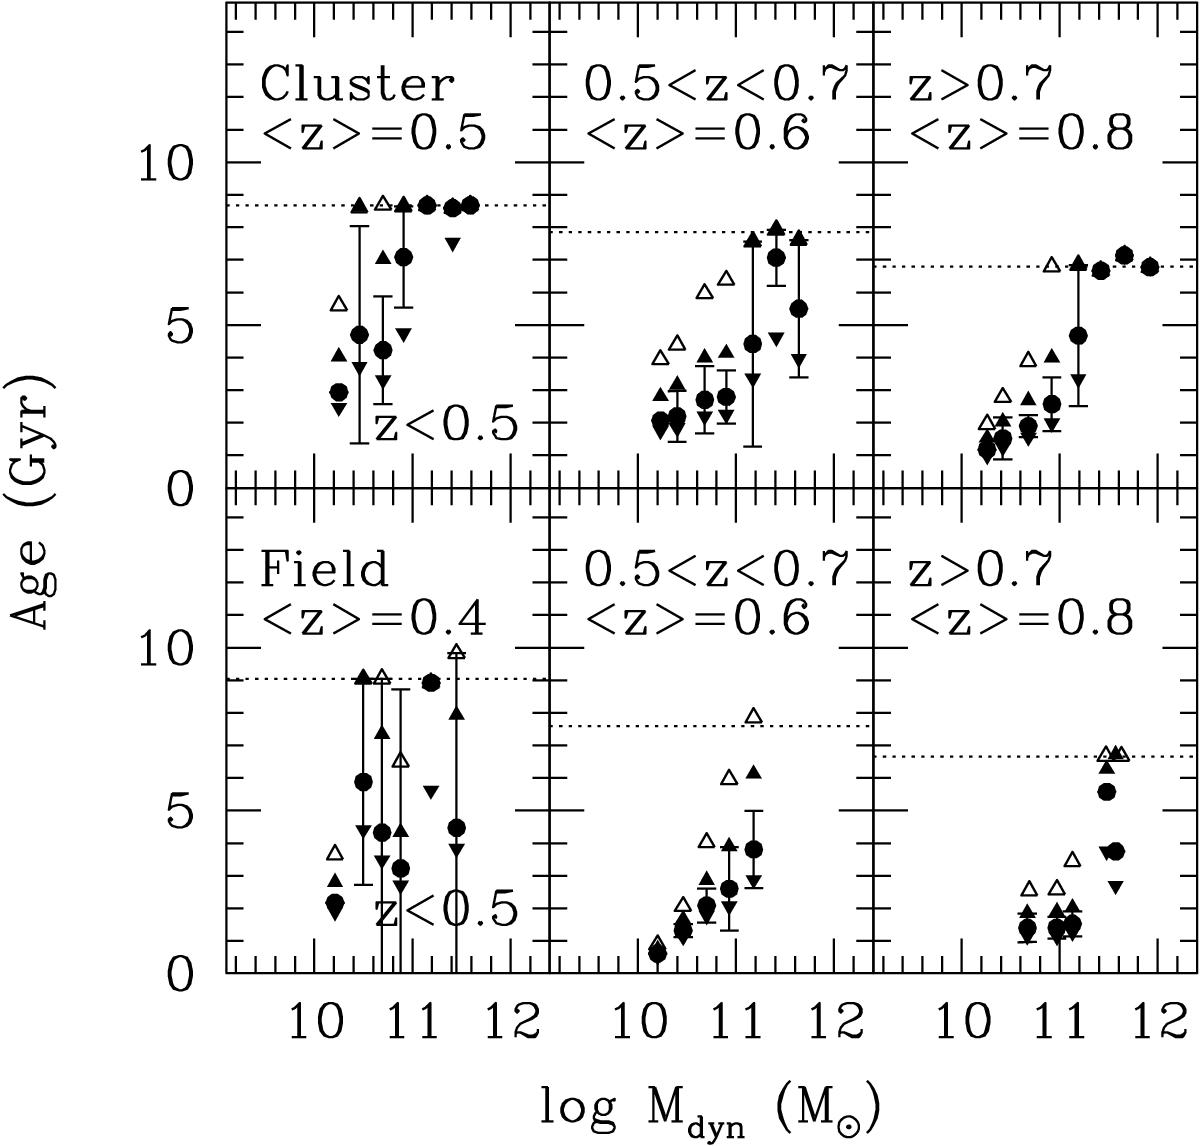
Ages of cluster (top) and field (bottom) galaxies at low (z< 0.5, left), medium (0.5 <z< 0.7, middle), and high (z> 0.7, right) redshifts as a function of dynamical mass. The circles show the ages as derived from the bare FP zero point evolution. The filled triangles pointing upwards take into account size evolution at constant M∗, case 2+10 (see Table 9);the open triangles pointing upwards show the (wrong) values presented in Fig. 25 of Saglia et al. (2010) for comparison. The triangles pointing downwards take into account the progenitor bias of van Dokkum & Franx (2001). The median redshifts are given and the corresponding ages of the Universe are shown by the dotted lines.
Current usage metrics show cumulative count of Article Views (full-text article views including HTML views, PDF and ePub downloads, according to the available data) and Abstracts Views on Vision4Press platform.
Data correspond to usage on the plateform after 2015. The current usage metrics is available 48-96 hours after online publication and is updated daily on week days.
Initial download of the metrics may take a while.