Fig. 4
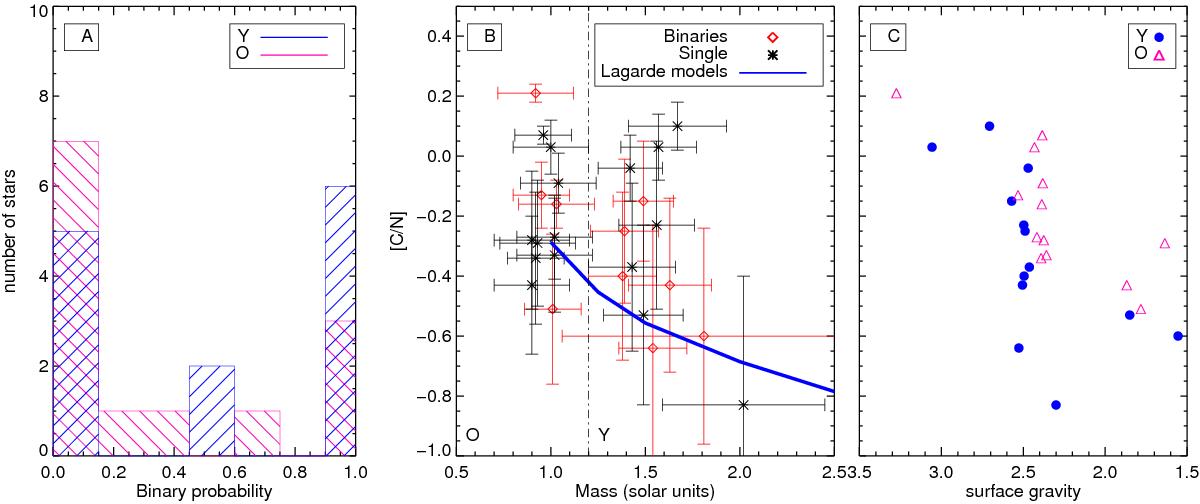
Panel A) distribution of stars as a function of binary probability. There are more Y stars with high probabilities of being binaries than O stars. Panel B) [C/N] abundances as a function of mass for our sample of stars. The vertical dashed line marks the mass threshold between O and Y stars. Red symbols denote stars with probabilities larger than 68% of being binaries, while black symbols denote stars more likely to be single. The blue solid line indicates the theoretical relation between [12C/14N] and stellar mass in a post-FDU population, from Lagarde et al. (2012). There is no significant relation between [C/N] and binarity in the sample and several Y stars do not follow the theoretical relation. Panel C) [C/N] abundances as a function of surface gravity. Blue circles correspond to the Y stars and pink triangles represent O stars.
Current usage metrics show cumulative count of Article Views (full-text article views including HTML views, PDF and ePub downloads, according to the available data) and Abstracts Views on Vision4Press platform.
Data correspond to usage on the plateform after 2015. The current usage metrics is available 48-96 hours after online publication and is updated daily on week days.
Initial download of the metrics may take a while.