Fig. 5
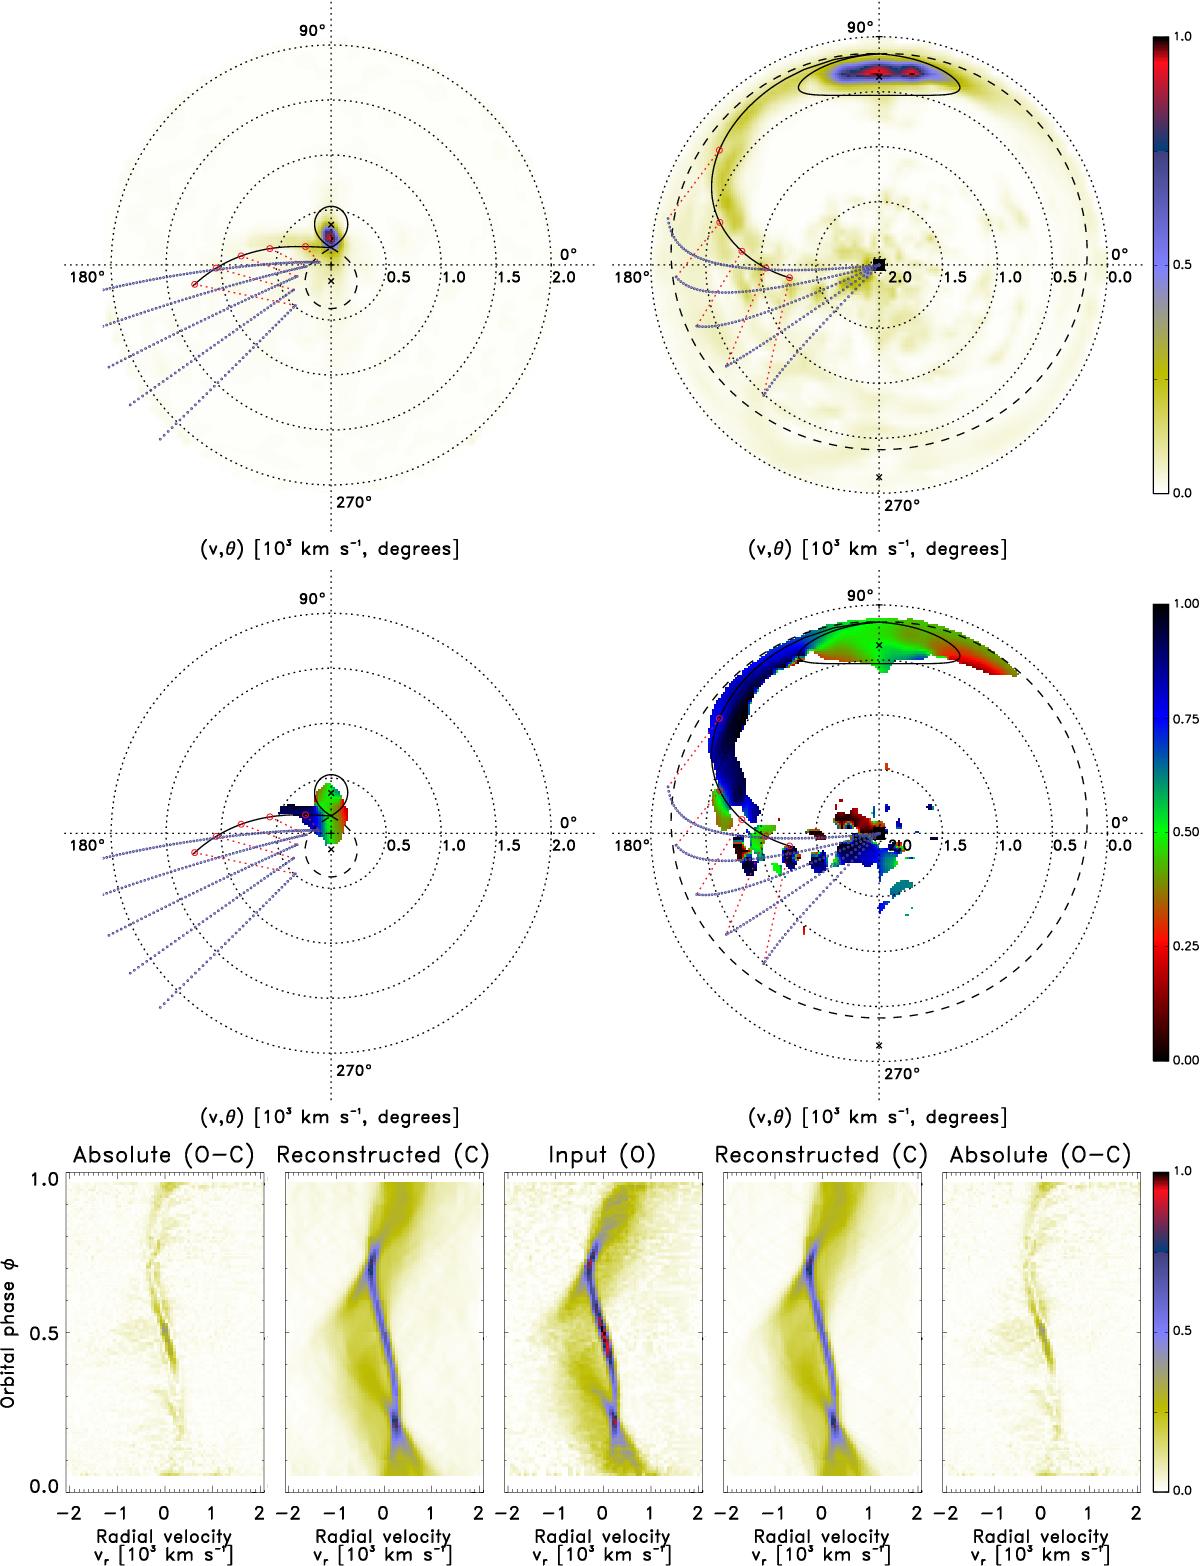
Flux modulation mapping of HU Aqr. The standard and inside-out velocity maps are shown left and right, respectively. The top two panels show the modulation amplitude maps and the middle two panels show the phase of maximum flux maps. The phase of maximum flux map shows only pixels where the corresponding modulation amplitude is at least 7.5% of the maximum amplitude. This map is colour coded to represent phase: black (0.0), red (0.25), green (0.5) and blue (0.75). The bottom middle panel shows the trailed input spectra. The panels to the left and right of the middle panel show the summed trailed reconstructed and absolute residual spectra for the corresponding 10 consecutive half-phase tomogram. The model velocity profile overlay shown in all the tomograms is the same as the one in Fig. 2.
Current usage metrics show cumulative count of Article Views (full-text article views including HTML views, PDF and ePub downloads, according to the available data) and Abstracts Views on Vision4Press platform.
Data correspond to usage on the plateform after 2015. The current usage metrics is available 48-96 hours after online publication and is updated daily on week days.
Initial download of the metrics may take a while.