Fig. 4
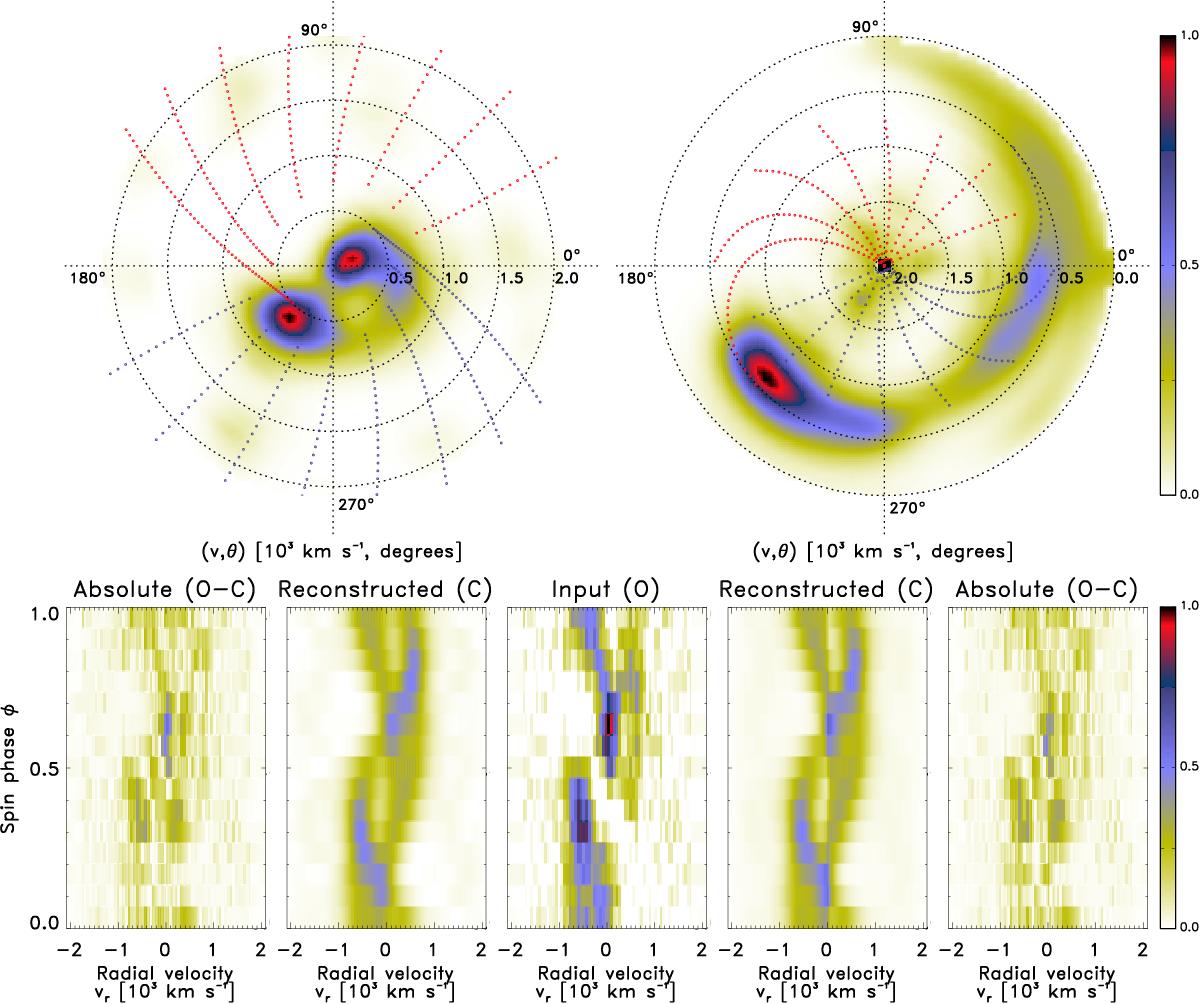
Spin-cycle Doppler tomography of PQ Gem. The standard and inside-out spin-cycle tomograms are shown top left and right, respectively. The bottom middle panel shows the trailed input spectra. The panels to the left and right of the middle panel show the trailed reconstructed and absolute residual spectra for the corresponding spin-cycle tomogram. The model velocity profile overlay shown in both tomograms is based on an inclination angle of 30°(Hellier 1997) and a dipolar axis co-latitude of 30°(Potter et al. 1997). As proposed by Hellier (1997) we use a spin-wave velocity amplitude of ~500 km s-1 and let the upper magnetic pole point towards us at spin phase 0.87 (dipolar axis azimuth ~47°). We allow the upper curtain (thin blue dotted lines) to extend over spin phase 0.63−0.96 and the lower curtain (thin red dotted lines) 0.13−0.46.
Current usage metrics show cumulative count of Article Views (full-text article views including HTML views, PDF and ePub downloads, according to the available data) and Abstracts Views on Vision4Press platform.
Data correspond to usage on the plateform after 2015. The current usage metrics is available 48-96 hours after online publication and is updated daily on week days.
Initial download of the metrics may take a while.