Fig. 2
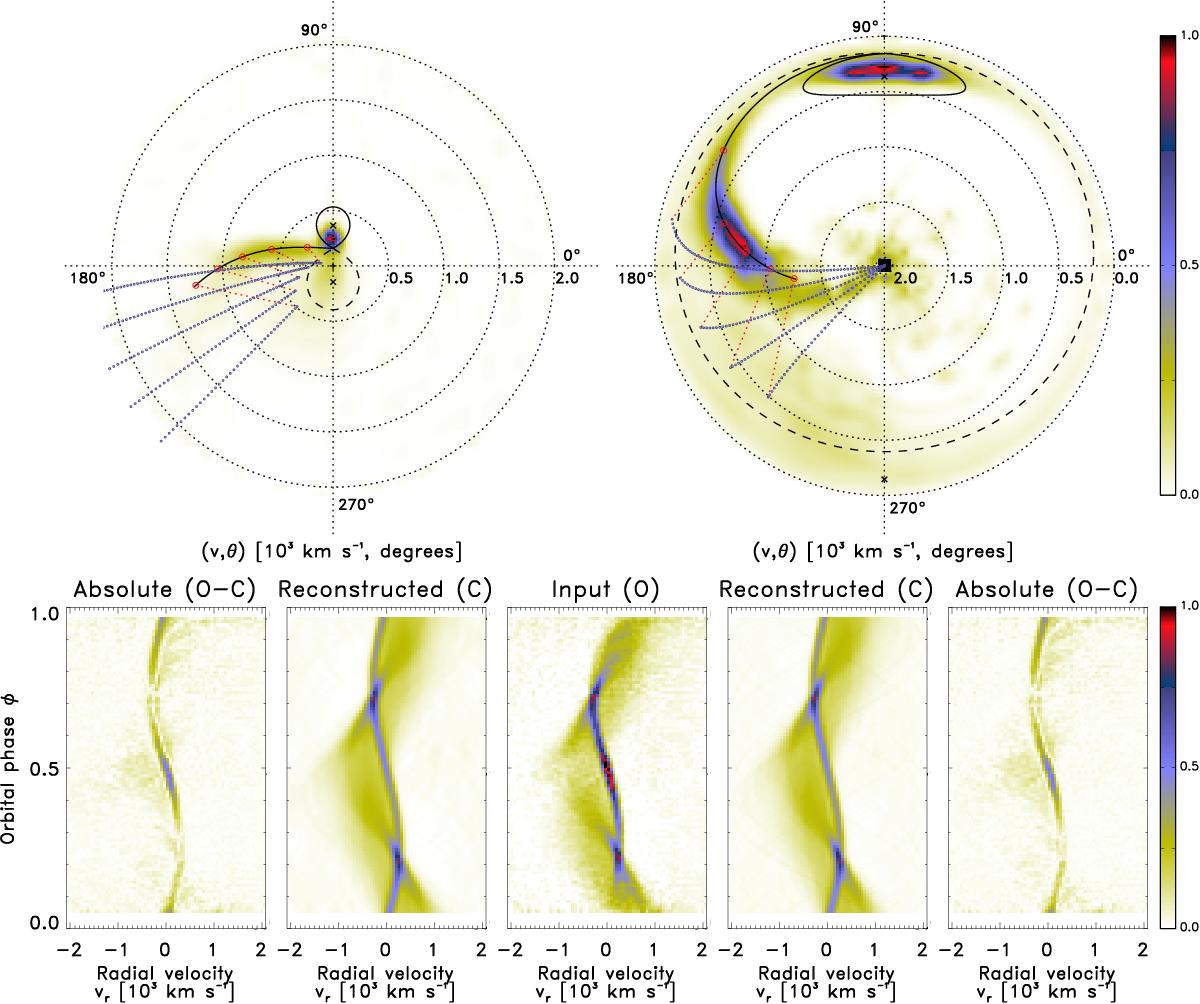
Doppler tomography of HU Aqr. The standard and inside-out tomograms are shown top left and right, respectively. The bottom middle panel shows the trailed input spectra. The panels to the left and right of the middle panel show the trailed reconstructed and absolute residual spectra for the corresponding tomogram. The model velocity profile overlay shown in both tomograms is based on one of the models used by Schwope et al. (1997) with an inclination angle of 84°, a primary mass of 0.875 M⊙, a mass ratio q = 0.40 and an orbital period of 0.086820446 d (~125 min). The overlay includes the Roche lobes of the primary (dashed line) and the secondary (solid line) as well as a single particle ballistic trajectory from the L1 point up to 45° in azimuth around the primary (solid line). Magnetic dipole trajectories are calculated at 10° intervals from 5° to 45° in azimuth around the primary (thin dotted lines). The first dipole trajectory starts at (123 km s-1, 167°), with consecutive trajectories starting at locations with progressively higher velocities and polar angles. The first dipole connection (small circles) is at (340 km s-1, 145°). The dipolar axis azimuth and co-latitude, as modelled by Heerlein et al. (1999), are ~38° and ~12°, respectively.
Current usage metrics show cumulative count of Article Views (full-text article views including HTML views, PDF and ePub downloads, according to the available data) and Abstracts Views on Vision4Press platform.
Data correspond to usage on the plateform after 2015. The current usage metrics is available 48-96 hours after online publication and is updated daily on week days.
Initial download of the metrics may take a while.