Fig. 4
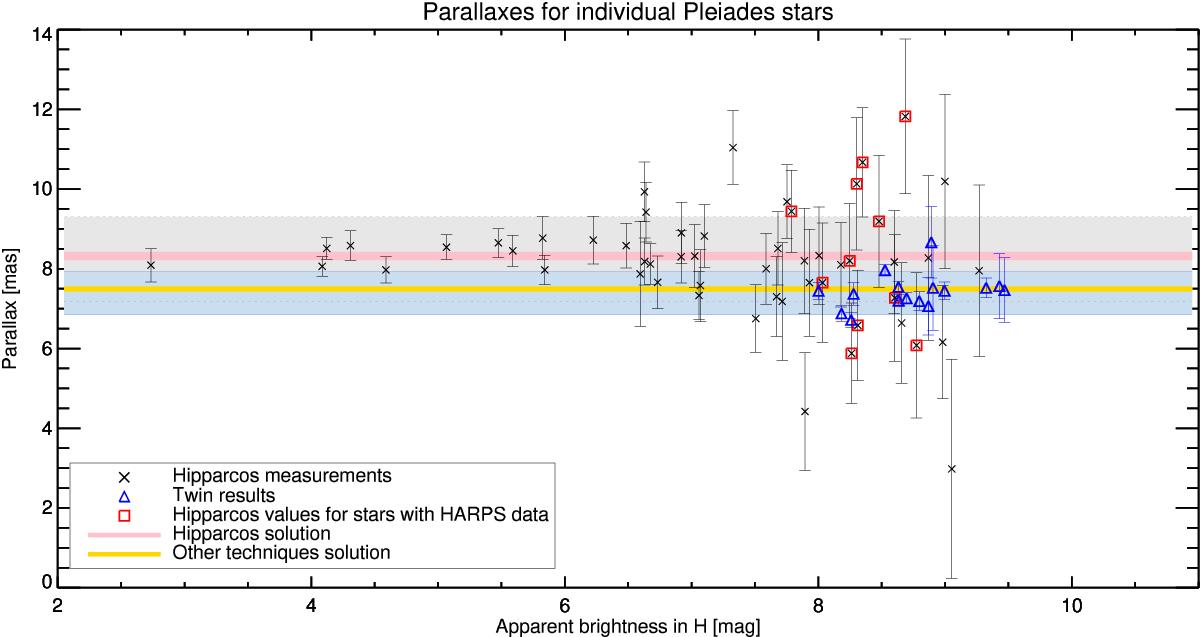
Parallaxes of 54 Pleiades stars of the Hipparcos solution are indicated with black crosses. The mean and standard deviation of these Hipparcos parallaxes is shown by the grey band enclosed by a dotted line. Eleven of the Hipparcos stars have HARPS spectra and have been analysed in this work (red squares). Our results are indicated with blue triangles. The standard deviation of these values are shown with the blue band enclosed by the blue line. The pink band represents the values of the Hipparcos solution within its margin of error, while the yellow band represents the range of the alternatives to Hipparcos.
Current usage metrics show cumulative count of Article Views (full-text article views including HTML views, PDF and ePub downloads, according to the available data) and Abstracts Views on Vision4Press platform.
Data correspond to usage on the plateform after 2015. The current usage metrics is available 48-96 hours after online publication and is updated daily on week days.
Initial download of the metrics may take a while.