Fig. 9
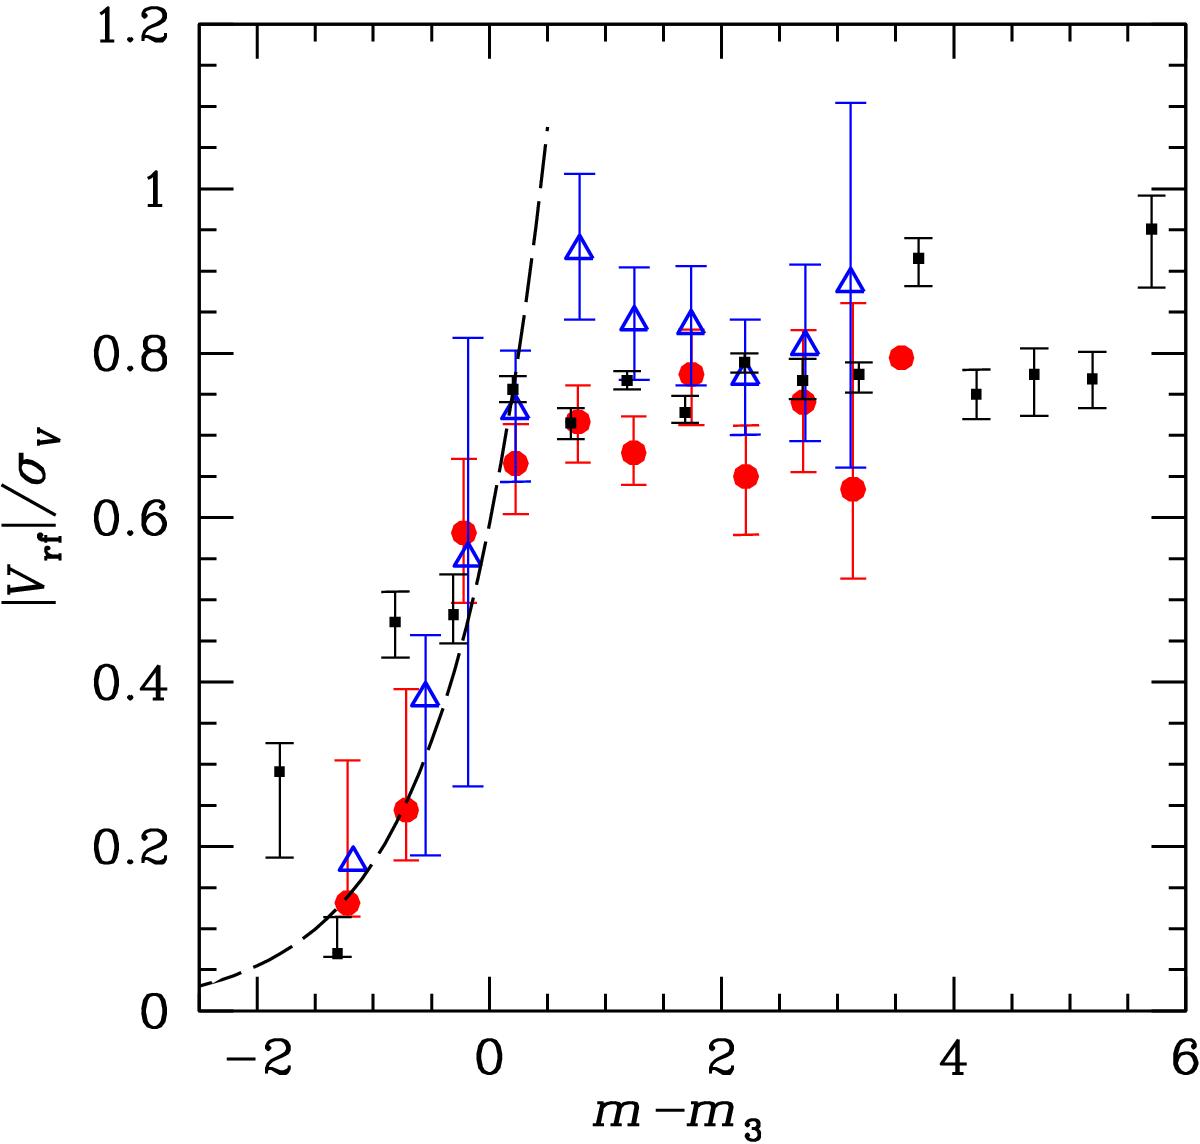
Normalized velocities of red and blue galaxies (solid red circles and blue open triangles) vs. m − m3, where m3 is the magnitude of the third brightest galaxy in each cluster. Data are binned in intervals of 0.5 mag. The error bars are obtained by a bootstrap resampling procedure. Points without error bars indicate the values based on only three galaxies. The dashed line represents our fit for red galaxies in the m − m3 ≤ 0.5 region. The results of Biviano et al. (1992) are shown for comparison (small black squares).
Current usage metrics show cumulative count of Article Views (full-text article views including HTML views, PDF and ePub downloads, according to the available data) and Abstracts Views on Vision4Press platform.
Data correspond to usage on the plateform after 2015. The current usage metrics is available 48-96 hours after online publication and is updated daily on week days.
Initial download of the metrics may take a while.