Fig. 5
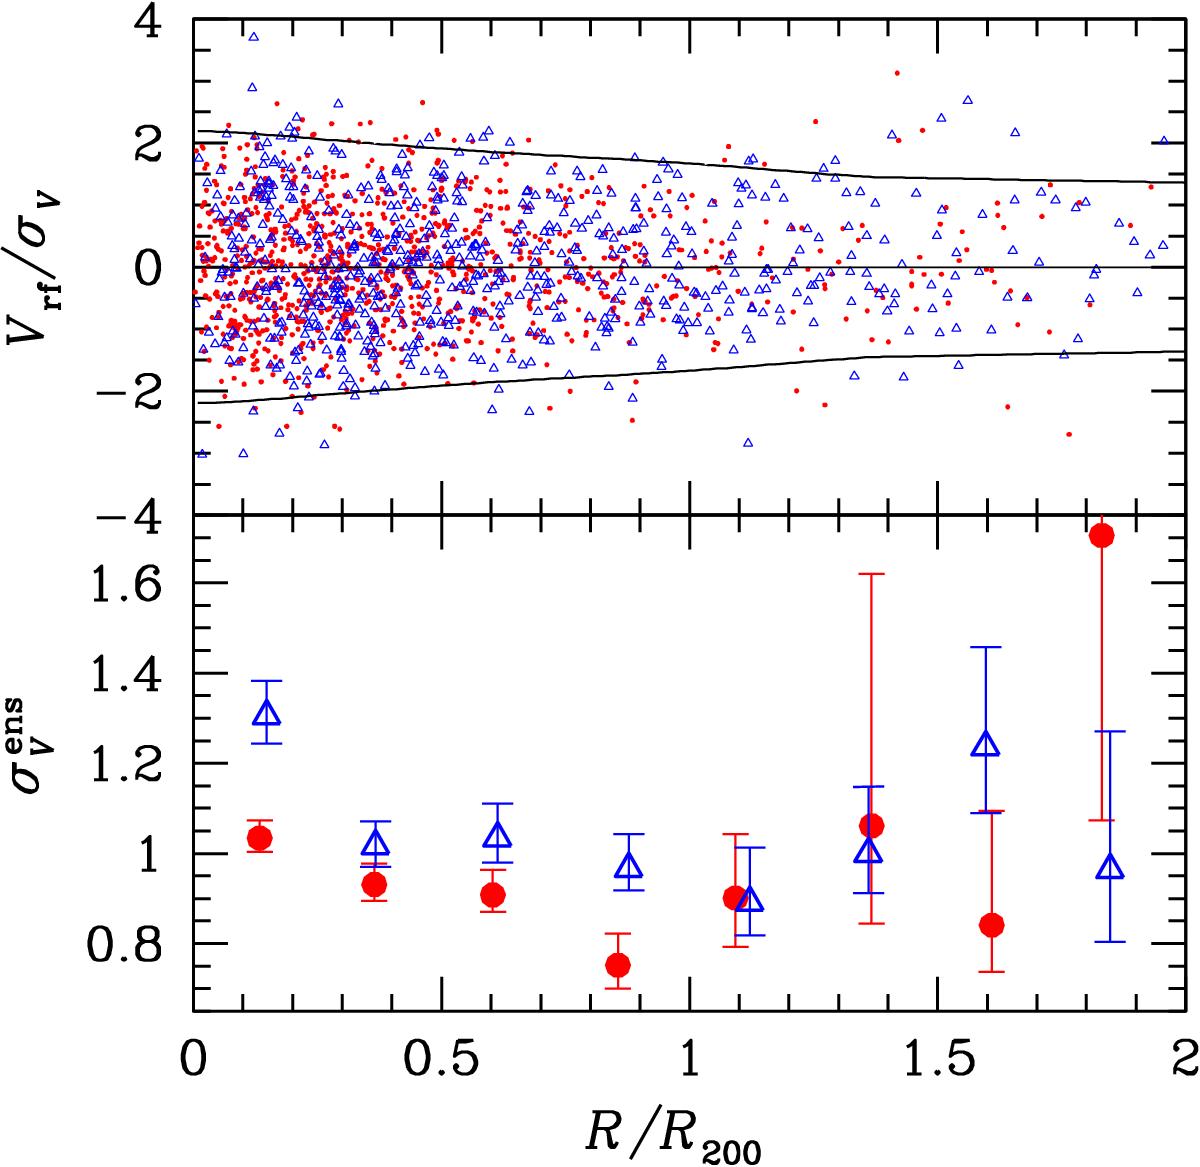
Upper panel: rest-frame LOS velocity vs. projected clustercentric distance for the galaxies of the ensemble cluster. Small red dots indicate red galaxies and blue triangles indicate blue galaxies. Black curves show the limits that are due to the escape velocity assuming a NFW mass profile (see text). Lower panel: velocity dispersion profiles (VDPs) for red and blue galaxies of the ensemble cluster (solid red circles and blue open triangles). Data are binned in intervals of 0.25 Mpc in the 0–2R200 range. The point abscissae are set to the averages of the R/R200 values of each sample within the bins. The error bars are determined by a bootstrap resampling procedure.
Current usage metrics show cumulative count of Article Views (full-text article views including HTML views, PDF and ePub downloads, according to the available data) and Abstracts Views on Vision4Press platform.
Data correspond to usage on the plateform after 2015. The current usage metrics is available 48-96 hours after online publication and is updated daily on week days.
Initial download of the metrics may take a while.