Fig. 2
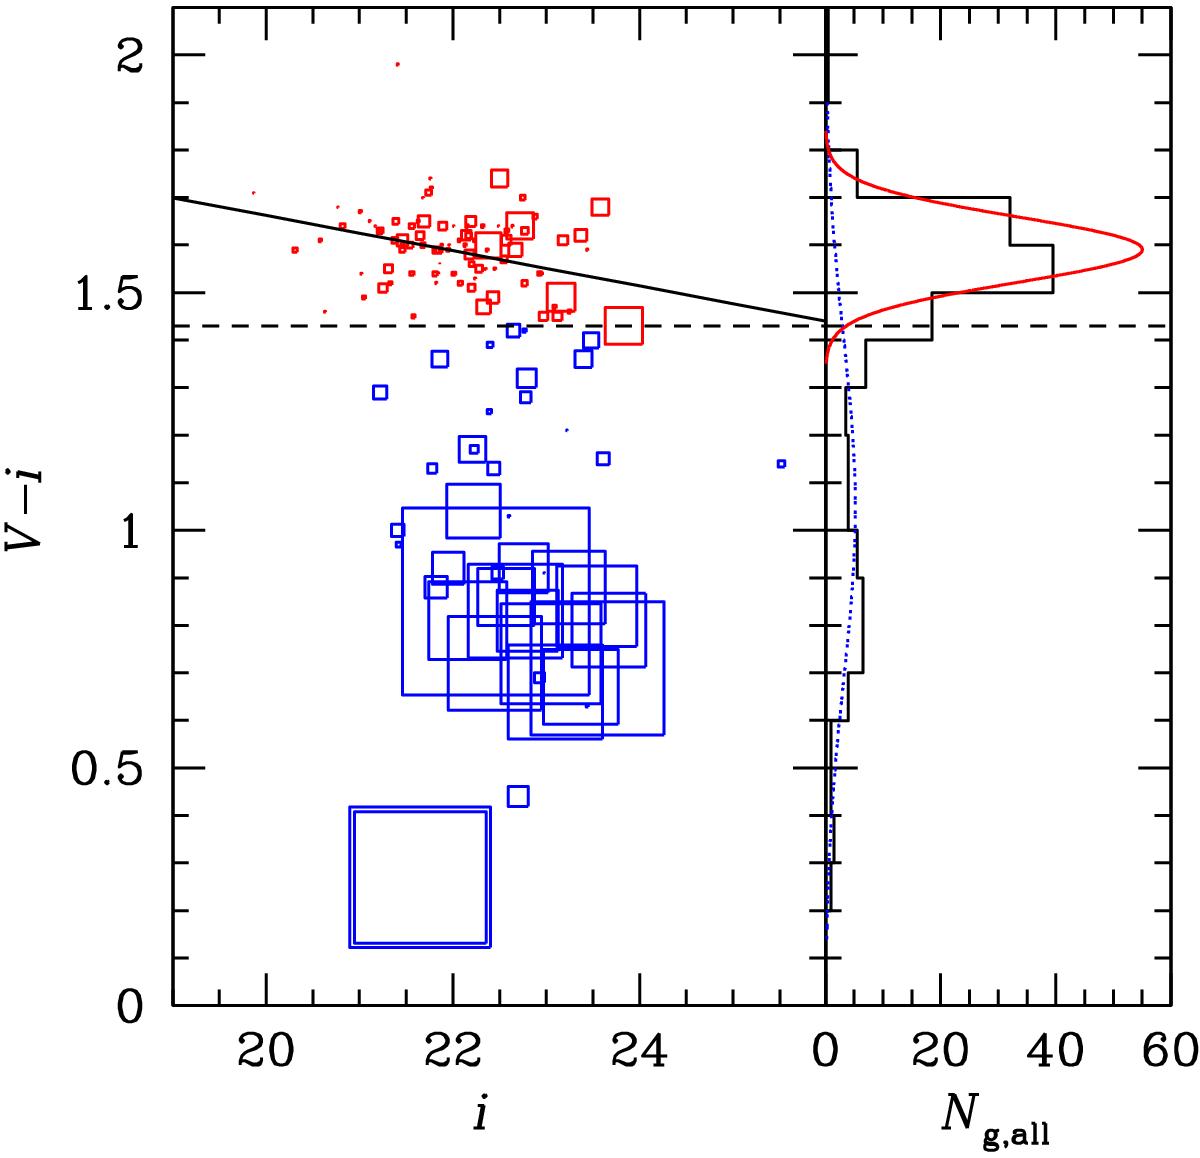
Separation between red and blue galaxies in the MS 1054.4−0321 cluster. Left panel: color−magnitude diagram. The horizontal dashed line indicates the color cut obtained using the V − i colors for member galaxies. For this well-sampled cluster we also show the red sequence line fitted with a two-sigma procedure applied to the red galaxies (black solid line). Larger sizes of the symbols for larger EW[OII] show the good agreement between the photometric and spectroscopic methods to separate red passive from blue star-forming galaxy populations. Right panel: distribution of V − i colors for member galaxies. The two Gaussians are obtained through the KMM method and allow us to define the color cut in the left panel.
Current usage metrics show cumulative count of Article Views (full-text article views including HTML views, PDF and ePub downloads, according to the available data) and Abstracts Views on Vision4Press platform.
Data correspond to usage on the plateform after 2015. The current usage metrics is available 48-96 hours after online publication and is updated daily on week days.
Initial download of the metrics may take a while.