Fig. 9
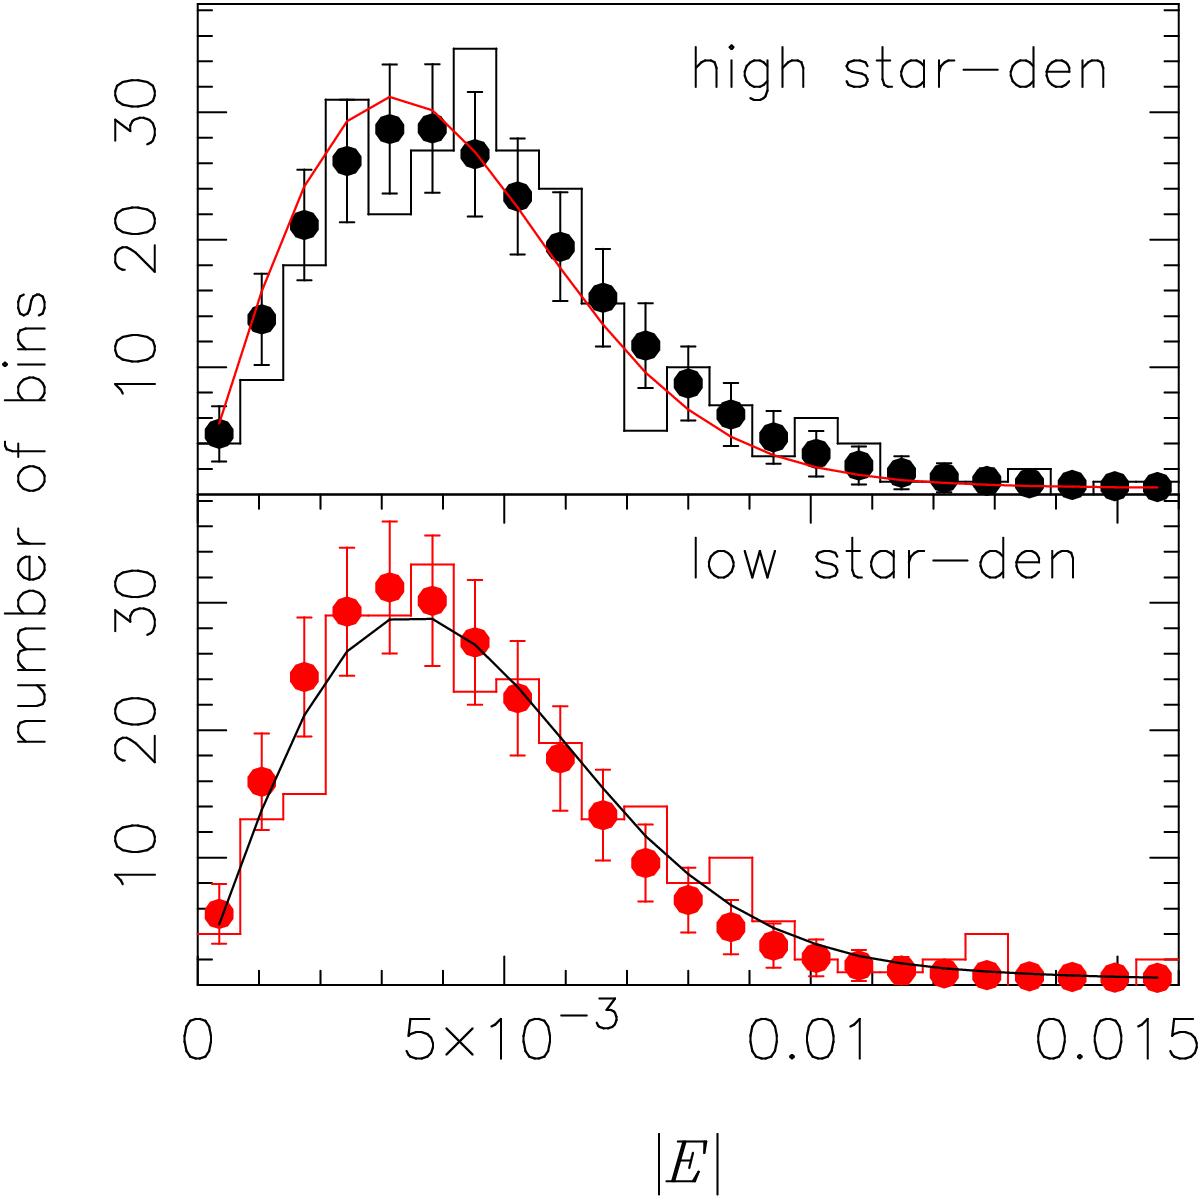
Histogram of mean ellipticity values in the G2 grid for the samples with higher than average (top) and lower than average (bottom) stellar density. The solid histogram shows the distribution for the original CFHTLenS catalogue, whilst the dots indicate the mean and scatter of 10 000 realisations where the ellipticities were randomised. The solid red line in the top panel indicates the mean of the randomised histograms of the bottom panel, and the black line in the bottom panel shows the mean of the randomised histograms of the top panel.
Current usage metrics show cumulative count of Article Views (full-text article views including HTML views, PDF and ePub downloads, according to the available data) and Abstracts Views on Vision4Press platform.
Data correspond to usage on the plateform after 2015. The current usage metrics is available 48-96 hours after online publication and is updated daily on week days.
Initial download of the metrics may take a while.