Fig. 6
![]() correlation functions as a function of separation between grid cells. In the middle panel, the signal is shown after removing one column/row at the edge of the grid, while in the right-hand panel, the first two columns/rows are removed. The left-hand panel shows the nominal signal for reference. The errors indicate the scatter between the cosmic shear-reduced bootstrap realisations. The middle row shows the weighted mean of
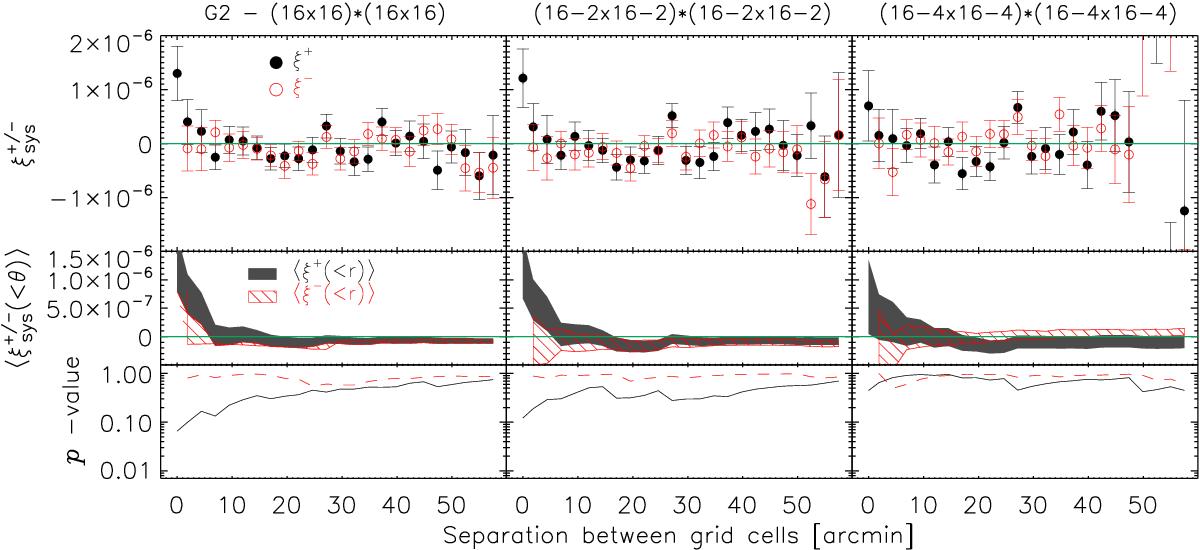
correlation functions as a function of separation between grid cells. In the middle panel, the signal is shown after removing one column/row at the edge of the grid, while in the right-hand panel, the first two columns/rows are removed. The left-hand panel shows the nominal signal for reference. The errors indicate the scatter between the cosmic shear-reduced bootstrap realisations. The middle row shows the weighted mean of ![]() and its 68% confidence intervals, determined using all radial bins up to the one of interest. The bottom row shows the p-values of the null hypothesis, with the solid black (red-dashed) line for
and its 68% confidence intervals, determined using all radial bins up to the one of interest. The bottom row shows the p-values of the null hypothesis, with the solid black (red-dashed) line for ![]() (
(![]() ).
).
Current usage metrics show cumulative count of Article Views (full-text article views including HTML views, PDF and ePub downloads, according to the available data) and Abstracts Views on Vision4Press platform.
Data correspond to usage on the plateform after 2015. The current usage metrics is available 48-96 hours after online publication and is updated daily on week days.
Initial download of the metrics may take a while.