Fig. 5
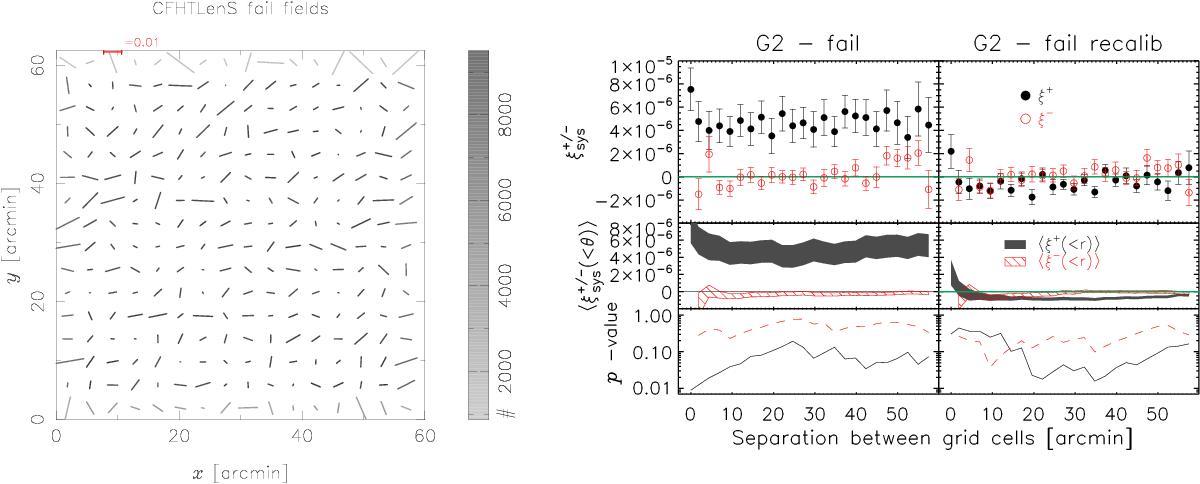
Left-hand panel: whisker plot showing the average galaxy ellipticity as a function of field position for the CFHTLenS fail fields. Middle/right-hand panel: the ![]() correlation function with and without recalibration. The middle row shows the weighted mean of
correlation function with and without recalibration. The middle row shows the weighted mean of ![]() and its 68% confidence intervals, determined using all radial bins up to the one of interest. The bottom row shows the p-values of the null hypothesis, with the solid black (red-dashed) line for
and its 68% confidence intervals, determined using all radial bins up to the one of interest. The bottom row shows the p-values of the null hypothesis, with the solid black (red-dashed) line for ![]() (
(![]() ). The remaining trends are worse than those observed in the fields that passed the Heymans et al. (2012) star-galaxy cross-correlation selection (shown in Fig. 3; note the different scaling of the y-axis).
). The remaining trends are worse than those observed in the fields that passed the Heymans et al. (2012) star-galaxy cross-correlation selection (shown in Fig. 3; note the different scaling of the y-axis).
Current usage metrics show cumulative count of Article Views (full-text article views including HTML views, PDF and ePub downloads, according to the available data) and Abstracts Views on Vision4Press platform.
Data correspond to usage on the plateform after 2015. The current usage metrics is available 48-96 hours after online publication and is updated daily on week days.
Initial download of the metrics may take a while.