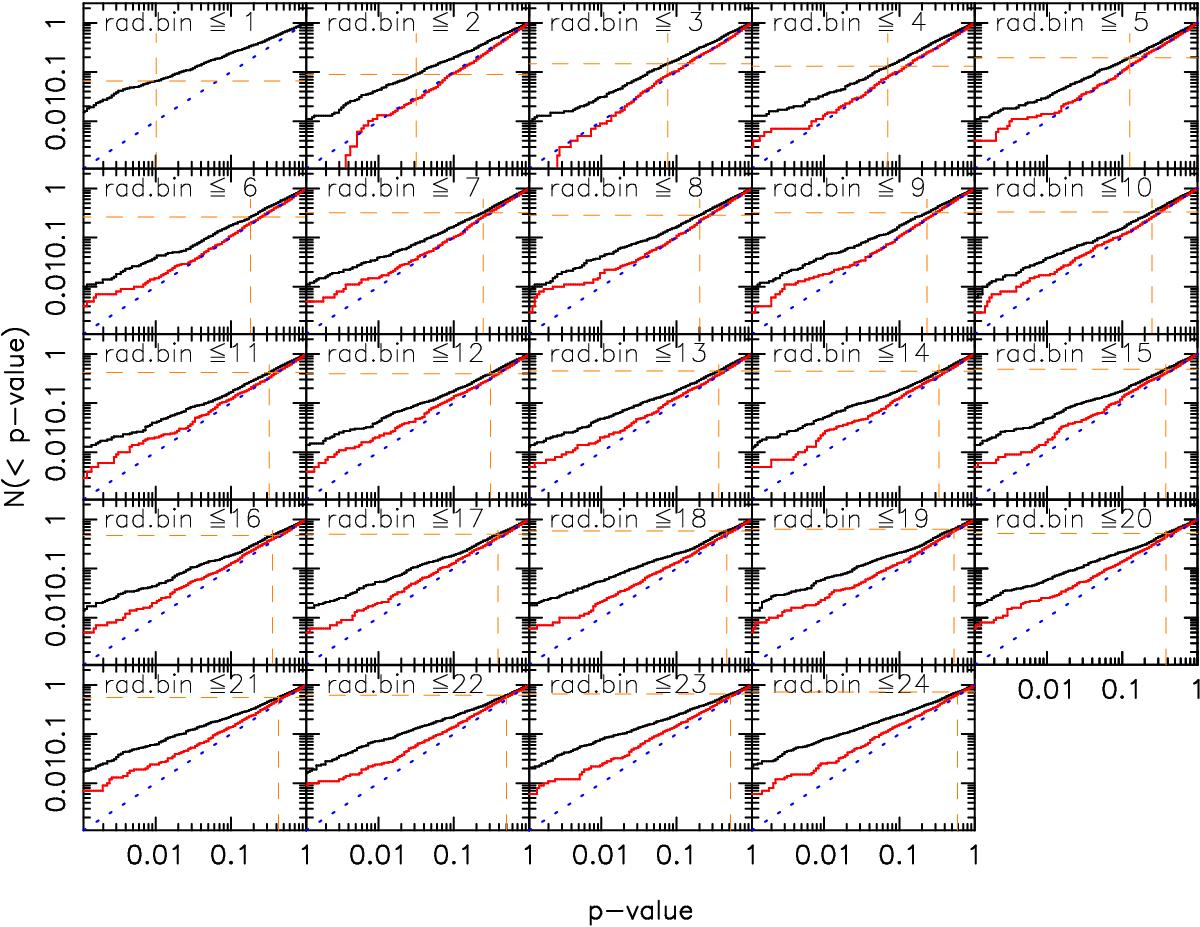
Fig. A.1

Cumulative distribution of the occurence of p-values corresponding to the χ2 value of the null hypothesis for the systematic shear correlation functions, determined using a large set of randomised catalogues. The different panels correspond, from left to right and top to bottom, to the increasing number of radial bins included in the fit (indicated in each panel). The black line shows the p-values of ![]() , the red line the p-values of
, the red line the p-values of ![]() . The blue dotted line shows the one-to-one correspondence; any departure from this line shows that the p-values from the χ2 of the null hypothesis do not correspond to the actual probability of
. The blue dotted line shows the one-to-one correspondence; any departure from this line shows that the p-values from the χ2 of the null hypothesis do not correspond to the actual probability of ![]() being zero. The orange dashed lines show how we convert the observed p-value in our data to the actual probability that
being zero. The orange dashed lines show how we convert the observed p-value in our data to the actual probability that ![]() is consistent with zero.
is consistent with zero.
Current usage metrics show cumulative count of Article Views (full-text article views including HTML views, PDF and ePub downloads, according to the available data) and Abstracts Views on Vision4Press platform.
Data correspond to usage on the plateform after 2015. The current usage metrics is available 48-96 hours after online publication and is updated daily on week days.
Initial download of the metrics may take a while.


