Fig. 12
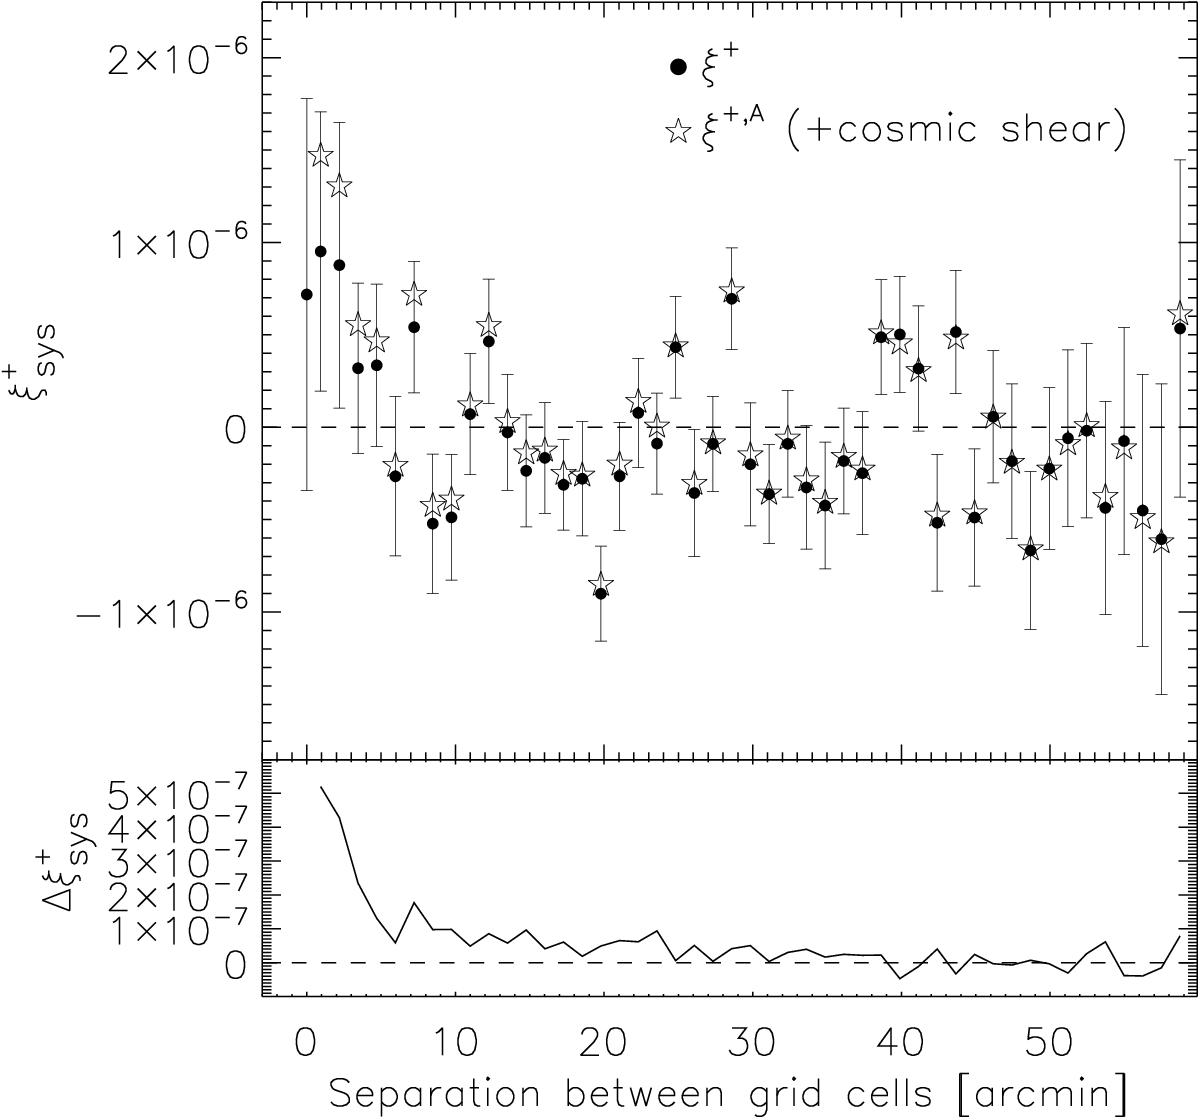
![]() correlation function as a function of separation between grid cells. The filled circles and the errors are the reference signal, whilst the open stars show the signal which includes a contribution from cosmic shear. The lower inset shows the difference between the two. The contribution from cosmic shear decreases with radius as expected.
correlation function as a function of separation between grid cells. The filled circles and the errors are the reference signal, whilst the open stars show the signal which includes a contribution from cosmic shear. The lower inset shows the difference between the two. The contribution from cosmic shear decreases with radius as expected.
Current usage metrics show cumulative count of Article Views (full-text article views including HTML views, PDF and ePub downloads, according to the available data) and Abstracts Views on Vision4Press platform.
Data correspond to usage on the plateform after 2015. The current usage metrics is available 48-96 hours after online publication and is updated daily on week days.
Initial download of the metrics may take a while.