Fig. 1
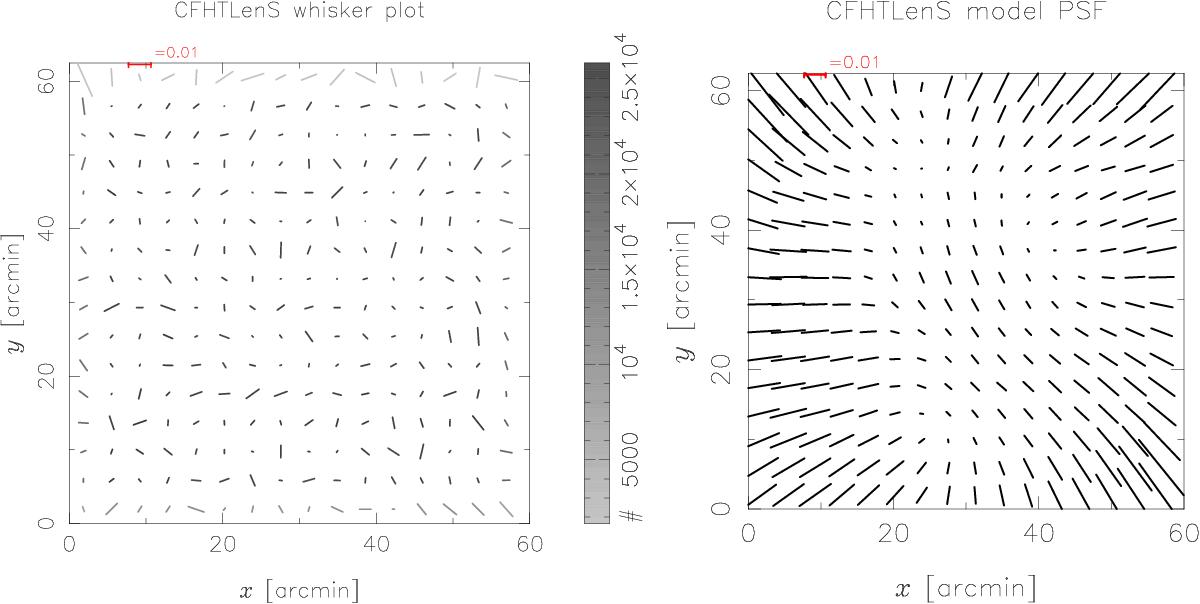
Left-hand panel: whisker plot showing the average galaxy ellipticity as a function of field position in the 128 CFHTLenS “pass” fields for the G2 grid (16 × 16). The sticks indicate the size and orientation of the averaged ellipticities. The grey-scale of the sticks indicate the number of galaxies in a grid cell. The range of the horizontal and vertical axis corresponds to the size of a CFHTLenS image. Right-hand panel: whisker plot of the average model PSF in CFHTLenS obtained by averaging the model PSFs at the location of the galaxies for the same grid.
Current usage metrics show cumulative count of Article Views (full-text article views including HTML views, PDF and ePub downloads, according to the available data) and Abstracts Views on Vision4Press platform.
Data correspond to usage on the plateform after 2015. The current usage metrics is available 48-96 hours after online publication and is updated daily on week days.
Initial download of the metrics may take a while.