| Issue |
A&A
Volume 595, November 2016
|
|
|---|---|---|
| Article Number | A28 | |
| Number of page(s) | 5 | |
| Section | Stellar structure and evolution | |
| DOI | https://doi.org/10.1051/0004-6361/201628707 | |
| Published online | 25 October 2016 | |
Three-dimensional simulations of turbulent convective mixing in ONe and CO classical nova explosions⋆
1 Physics Division, Oak Ridge National Laboratory, PO Box 2008, Oak Ridge, TN 37831–6354, USA
e-mail: This email address is being protected from spambots. You need JavaScript enabled to view it.
2 Departament de Física, EUETIB, Universitat Politècnica de Catalunya, c/Comte d’Urgell 187, 08036 Barcelona, Spain
3 Institut d’Estudis Espacials de Catalunya, c/Gran Capità 2–4, Ed. Nexus–201, 08034 Barcelona, Spain
4 Departament de Física, Universitat Politècnica de Catalunya, c/Esteve Terrades 5, 08860 Castelldefels, Spain
5 Dipartimento di Fisica “Enrico Fermi”, Università di Pisa and INFN, Sezione di Pisa, Largo B. Pontecorvo 3, 56127 Pisa, Italy
Received: 13 April 2016
Accepted: 28 June 2016
Abstract
Classical novae are thermonuclear explosions that take place in the envelopes of accreting white dwarfs in binary systems. The material piles up under degenerate conditions, driving a thermonuclear runaway. The energy released by the suite of nuclear processes operating at the envelope heats the material up to peak temperatures of ~(1−4) × 108 K. During these events, about 10-3−10-7 M⊙, enriched in CNO and, sometimes, other intermediate-mass elements (e.g., Ne, Na, Mg, Al) are ejected into the interstellar medium. To account for the gross observational properties of classical novae (in particular, the high concentrations of metals spectroscopically inferred in the ejecta), models require mixing between the (solar-like) material transferred from the secondary and the outermost layers (CO- or ONe-rich) of the underlying white dwarf. Recent multidimensional simulations have demonstrated that Kelvin-Helmholtz instabilities can naturally produce self-enrichment of the accreted envelope with material from the underlying white dwarf at levels that agree with observations. However, the feasibility of this mechanism has been explored in the framework of CO white dwarfs, while mixing with different substrates still needs to be properly addressed. Three-dimensional simulations of mixing at the core-envelope interface during nova outbursts have been performed with the multidimensional code FLASH, for two types of substrates: CO- and ONe-rich. We show that the presence of an ONe-rich substrate, as in “neon novae”, yields higher metallicity enhancements in the ejecta than CO-rich substrates (i.e., non-neon novae). A number of requirements and constraints for such 3D simulations (e.g., minimum resolution, size of the computational domain) are also outlined.
Key words: novae, cataclysmic variables / nuclear reactions, nucleosynthesis, abundances / convection / hydrodynamics / instabilities / turbulence
Movies associated to Fig. 1 are available at http://www.aanda.org
© ESO, 2016
1. Introduction
Classical novae repeatedly eject ~10-3−10-7M⊙ into the interstellar medium in intervals of years (for the fastest recurrent novae) to tens of millennia (for the most common classical novae). High-resolution spectroscopy has revealed the presence of nuclear-processed material relative to solar abundances in these ejecta (see, e.g., Gehrz et al. 1998; Downen et al. 2013). Nova explosions are thought to be important sources of Galactic 15N, 17O, and 13C (see Starrfield et al. 2008, 2016; José & Shore 2008; and José 2016, for recent reviews). Hydrodynamic simulations have shown that nuclear processing of the accreted material alone is unable to account for the high metallicities inferred in the ejecta because only moderate peak temperatures are reached during the outburst. Instead, mixing at the core-envelope interface has been regarded as a feasible alternative to nuclear processing. Several mechanisms have been proposed to this end, including diffusion-induced convection (Prialnik & Kovetz 1984; Kovetz & Prialnik 1985; Iben et al. 1991, 1992; Fujimoto & Iben 1992), shear mixing (Durisen 1977; Kippenhahn & Thomas 1978; MacDonald 1983; Livio & Truran 1987; Kutter & Sparks 1987; Sparks & Kutter 1987), convective overshoot-induced flame propagation (Woosley 1986), and convection-induced shear mixing (Kutter & Sparks 1989). While all these mechanisms most likely participate in producing the metallicity enhancement of the ejecta, 1D simulations have shown that none can successfully account for the full range of values inferred spectroscopically (see Livio & Truran 1990, for a detailed account of the shortcomings of these different mechanisms).
It has become increasingly clear that 1D spherically symmetric simulations, while capable of reproducing the main observational features of the nova outburst, exclude an entire sequence of events associated with the way a thermonuclear runaway initiates and propagates (Shara 1982). With the advent of supercomputing capabilities in the past decades, a number of 2D and 3D simulations of mixing at the core-envelope interface during nova outbursts have been published (Glasner & Livne 1995; Glasner et al. 1997, 2005, 2007; Kercek et al. 1998, 1999; Rosner et al. 2001; Alexakis et al. 2004; Casanova et al. 2010, 2011a,b). These multidimensional efforts have confirmed that Kelvin-Helmholtz instabilities that appear at the late stages of the explosion can naturally lead to self-enrichment of the accreted envelopes with material from the underlying (CO) white dwarfs, at levels consistent with observations. The results are reliable because they are determined independent of the specific choice of the initial perturbation (duration, strength, location, and size), numerical resolution, or the size of the computational domain (Casanova et al. 2011a).
To date, only two studies have reported multidimensional (2D) simulations with different compositions for the underlying white dwarf (Glasner et al. 2012, 2014). As in previous work, only a slice of the star (0.1 π rad), in spherical-polar coordinates (with a maximum resolution of 1.4 km × 1.4 km) was modeled, with a reduced network containing 15 isotopes (up to 17F; Glasner et al. 2012) and 35 isotopes (up to 27Al; Glasner et al. 2014). The simulations assumed a 1.147 M⊙ white dwarf and different compositions (CO, pure He, pure 16O, and pure 24Mg). The studies support the idea that Kelvin-Helmholtz instabilities also operate for different chemical substrates. However, no realistic multidimensional simulations of mixing for the typical composition of an ONe white dwarf were reported in Glasner et al. (2012, 2014). The present paper aims to fill this gap. We report the first 3D simulation of mixing at the core-envelope interface during nova outbursts for ONe white dwarfs.
The paper is organized as follows. The input physics and initial conditions of the simulations are described in Sect. 2. A full account of two 3D simulations of mixing performed at the core-envelope interface of an ONe white dwarf and, for comparison, a CO-rich white dwarf, are presented in Sect. 3. Finally, the significance of our results and our main conclusions are summarized in Sect. 4.
2. Input physics and initial setup
Accretion of solar composition material (Z ~ 0.02) onto a 1.25 M⊙ ONe white dwarf at a rate of 2 × 10⁻¹⁰ M⊙ yr-1 was simulated with the 1D implicit Lagrangian hydrodynamic code SHIVA (José & Hernanz 1998; José 2016). We have used this code extensively for the modeling of classical nova outbursts, from accretion to the ultimate explosion, expansion, and ejection stages. We adopted the composition of the outer white dwarf layers from Ritossa et al. (1996): X(16O) = 0.511, X(20Ne) = 0.313, X(23Na) = 0.0644, X(24Mg) = 0.0548, X(25Mg) = 0.0158, X(27Al) = 0.0108, X(12C) = 0.00916, X(26Mg) = 0.00989, X(21Ne) = 0.00598, and X(22Ne) = 0.00431. When the temperature at the core-envelope interface reached Tce ~ 108 K, the structure was mapped onto a 3D cartesian grid (hereafter, model A) that was followed with the multidimensional parallelized explicit Eulerian FLASH code. It is based on the piecewise parabolic interpolation of physical quantities to solve the hydrodynamic equations that describe the stellar plasma (Fryxell et al. 2000). The code uses adaptive mesh refinement to improve the accuracy in critical regions of the computational domain. The 3D computational domain1, 800 × 800 × 400 km3, initially comprised 88 unevenly spaced radial layers and 512 equally spaced layers along each horizontal axis, in hydrostatic equilibrium. The maximum resolution adopted, with five levels of refinement, was 1.56 × 1.56 × 1.56 km3 to handle the sharp discontinuity at the core-envelope interface, although the typical zoning employed in the simulation was 3.125 km in each dimension. Periodic boundary conditions were implemented at lateral sides, while hydrostatic conditions were imposed through the vertical boundaries, reinforced with a reflecting condition at the bottom and an outflow condition at the top (Zingale et al. 2002; Casanova et al. 2010, 2011a,b). A reduced nuclear reaction network containing 31 species (1H, 4He, 12,13C, 13,14,15N, 14,15,16,17O, 17,18F, 20,21Ne, 21,22,23Na, 22,23,24,25Mg, 24,25,26g,26m,27Al, 26Mg, and 26,27,28Si, where 26gAl and 26mAl represent the ground and a short-lived isomeric state in 26Al, respectively) was included to treat the energetics of the event. The network was linked through 41 nuclear interactions, mainly p-captures and β+-disintegrations. The corresponding rates were taken from the STARLIB nuclear reaction library (Iliadis et al. 2010). To break the initial equilibrium configuration, we introduced at the first timestep a top-hat temperature perturbation (5%) in a 4 km wide spot, located at (x,y,z) = (5 × 107,5 × 107,3.754 × 108) cm, close to the core-envelope interface.
For comparison, we computed a second 3D model of mixing with a CO-rich substrate (hereafter, model B). As in model A, the early accretion and explosion stages were computed in spherical symmetry with the SHIVA code, assuming accretion of solar composition material onto a 1 M⊙ CO white dwarf at a rate of ~2 × 10⁻¹⁰ M⊙ yr-1. The total envelope mass accreted in model B reached 6.2 × 10⁻⁵ M⊙ (2.2 × 10⁻⁵ M⊙ in model A). The reduced nuclear network was the same as in Casanova et al. (2010, 2011a,b) since the main nuclear activity does not extend beyond the CNO-region. This network contained 13 chemical species (1H, 4He, 12,13C, 13,14,15N, 14,15,16,17O, and 17,18F) linked through 18 nuclear interactions. The composition of the underlying white dwarf was X(12C) = X(16O) = 0.5. The initial configuration and the temperature perturbation were chosen to match the same initial conditions as model A.
Both 3D simulations used 512 Intel SandyBridge processors at the MareNostrum supercomputer (BSC), requiring about 90 khr of computation for model A and 25 khr for model B.
3. Results
In both models, the initial temperature perturbation creates fluctuations along the core-envelope interface that develop strong buoyant fingering. The early development of these primary fluid instabilities is depicted in Fig. 1; we show the 20Ne (model A; upper panel) and 12C mass fractions (model B; lower panel). Movies showing the development of Kelvin-Helmholtz instabilities, up to the time when the convective front hits the upper computational boundary, are available online2.
Fingering appears within the first 50 s. However, for the ONe-rich substrate (model A) the development of such fluid instabilities continues for a longer time, up to ~170 s. This drives an efficient dredge-up of outer core material into the envelope by the rapid formation of small convective eddies at the innermost envelope layers. In model A, the build-up of the first circulation (convective) structures occurs at ~200 s, much later than for model B (i.e., ~50 s). Ignition for solar-metallicity models3 is driven by the reaction 12C+p, which is faster than the alternative channels, 16O+p or 20Ne+p. Therefore, the amount of 12C present in the envelope critically determines the ignition time. Since the presence of a C(O)-rich substrate (as in model B) produces larger dredge-up of 12C into the envelope than for an ONe-rich substrate, ignition (and in turn, the establishment of superadiabatic gradients required for convection) occurs earlier in model B.
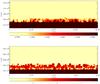 |
Fig. 1 Snapshots of the early development and growth of buoyant fingering for model A (t = 130 s; upper panel) and model B (t = 40 s; lower panel), shown in terms of 20Ne and 12C mass fractions, respectively, in logarithmic scale. The two snapshots correspond to 2D slices on the xz plane, taken at y = 4 × 107 cm. In both models, the initial buoyant fingering appears within the first 50 s, although it lasts longer (up to 170 s) in model A. See movies. |
The onset of convection is accompanied by shear flows at the core-envelope interface. This causes dredge-up of outer core material by means of Kelvin-Helmholtz instabilities. As a result, the envelope becomes progressively enhanced in intermediate-mass nuclei. The convective front eventually extends throughout the entire envelope (Fig. 2). The expansion and progress of the explosion toward the outer envelope layers proceeds almost in spherical symmetry. This explains the success of 1D models in describing the main observational features of classical nova outbursts (Starrfield et al. 1998; 2009; Kovetz & Prialnik 1997; Yaron et al. 2005; José & Hernanz 1998). As burning proceeds, the velocity and temperature of the material increase. After about 500 s, convection turns strongly intermittent and, apparently, turbulent. This state continues to the end of the computation. The flow exhibits structures on a wide range of scales, with filaments as large as 200 km that extend from the core-envelope interface through the upper envelope layers. The flow shows indications of a cascade, with the largest eddies spawning progressively smaller features, which in turn fragment and merge. The interface becomes more irregular after ~600 s. Individual knots and filaments of enhanced 20Ne abundance persist on scales of about 50 km for up to ~10 s. In contrast to the static display from about 490 s to about 560 s, a rapid advance of the mixing front4 begins at about 560 s. The Ne front jumps from 392 km to 404 km in about 37 s. At this stage, burning proceeds as a subsonic flame. This is the same conclusion as reached in Casanova et al. (2011b) for a CO substrate. This filamentary behavior and the development of vortex structures of different sizes are a signature of intermittency and observational evidence of the energy transfer cascade into smaller scales predicted by Kolmogorov’s theory of turbulence (Lesieur et al. 2001; Shore 2007; Pope 2000). The turbulent flow shows density contrasts that become chemically inhomogeneous. The nuclear yield is therefore characterized as a distribution and not as a sharp value, as in 1D models. This is illustrated by the abundance distribution of a trace species, 15O, in a 100 km wide layer (comparable to the pressure scale height), located well above the core-envelope interface, extending from 3.91 × 10⁸ to 4.01 × 108 cm at the beginning (t = 0 s) and at the end of the simulation (t = 751 s). As shown in Fig. 3, the initially discrete distribution evolves into a stable form that is approximately a Gaussian with a dispersion of 25%. There is, however, a so-called “fat tail” that extends toward high abundances and accounts for ~7% of the yield. Such chemical inhomogeneities have been observed in the ejecta of many classical novae that did not interact strongly with the ambient material (Shore et al. 1997; Porter et al. 1998; Vaytet et al. 2007). Although several collisions and supersonic motions following the outburst can amplify the initial inhomogeneities, their physical origin points to the intermittent behavior of turbulence.
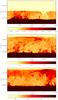 |
Fig. 2 Snapshots of the development of the convective front in model A, at t = 437 s (upper panel), 635 s (central panel), and 709 s (lower panel), shown in terms of the 20Ne mass fraction, in logarithmic scale. Snapshots correspond to 2D slices on the xz plane, taken at y = 4 × 107 cm. The dredge-up of fresh material from the outer core, driven by Kelvin-Helmholtz instabilities, translates into a mean metallicity in the envelope of 0.211, 0.234, and 0.241, respectively. The mean metallicity at the end of the simulation reaches 0.246, by mass, for this model. |
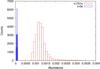 |
Fig. 3 Abundance distribution of 15O at the beginning (blue) and end (t = 751 s; red) of the simulation in model A. The histograms contain about 24 500 points from a 100 km thick layer, located well above the core-envelope interface (~150 km). The initially narrow and discrete distribution eventually evolves into an inhomogeneous distribution that fits a Gaussian with a dispersion of 25% in the mean value. |
Model A was stopped as soon as the convective front reached the top of the computational domain, after sweeping 325 km (corresponding to ~3 pressure scale heights). The maximum temperature in this simulation was 2.02 × 10⁸ K with peak fluid velocities ~107 cm s-1 and accordingly very low Mach numbers. At the end of the simulation, the mean metallicity of the envelope reached 0.246, about 12 times the initial value. These results confirm that Kelvin-Helmholtz instabilities in the presence of an ONe-rich substrate can also yield strong metallicity enhancements in the envelope through convective dredge-up at levels that agree with observations. For model B, the development of the outburst and the mixing episodes proceeds similarly, but the metallicity enhancement is lower, Z = 0.105 (about five times the initial value). This results from the shorter duration of the dredge-up phase because mixing with a 12C-rich substrate significantly reduces the time required to drive a thermonuclear runaway.
4. Discussion and limitations
The feasibility of Kelvin-Helmholtz instabilities as a mechanism for self-enrichment of accreted envelopes with material from different substrates has also been explored by Glasner et al. (2012). They computed the 1D evolution of an accreting 1.147 M⊙ white dwarf, subsequently mapping the 3.4 × 10⁻⁵ M⊙ accreted envelope as well as the outer 4.7 × 10⁻⁵ M⊙ of the underlying white dwarf into a 2D spherical-polar grid. All the different substrates considered consisted of one-species gas (i.e., pure He, O, Ne, or Mg). The authors found that “significant enrichment (around 30 per cent) of the ejected layer, by the convective dredge-up mechanism, is a common feature of the entire set of models, regardless of the composition of the accreting white dwarf”. Other properties of the outburst, such as the characteristic timescale of the explosion, were found to depend more sensitively on the composition of the substrate.
A detailed comparison between our results and those of Glasner et al. (2012) faces several limitations. The one-species assumption in Glasner et al. is an important oversimplification when modeling the composition of the substrate. The white dwarfs that produce nova explosions are CO- or ONe-rich, but also contain a blend of different species. Moreover, the critical mass and extent of the accreted envelopes depend critically on the properties of the underlying white dwarf. The layer is more massive for CO- than for ONe-rich white dwarfs because the latter are more massive than the former (see, e.g., Starrfield et al. 1989; José & Hernanz 1998; Yaron et al. 2005; José 2016), an effect not taken into account in Glasner et al. since they aimed at testing the importance of Kelvin-Helmholtz instabilities in driving mixing with different substrates and did not pursue a quantitative analysis of the extent of such mixing. In contrast, the study we present is a self-consistent simulation of mixing during a nova employing realistic models for the ONe-rich substrate.
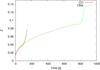 |
Fig. 4 Time-evolution of the mean metallicity of the envelope in the 2D models with underlying CO (solid line) and ONe white dwarfs (dashed line). |
Determining the influence of the substrate on the degree of mixing is hard to assess directly from our models, however. Using different envelope sizes and masses in our 3D simulations, although self-consistently computed in 1D hydrodynamics, coupled to different substrates makes it hard to distinguish the effects of substrate abundance, white dwarf mass, and accreted mass. We therefore computed two 2D high-resolution (780 × 780 m) models with the same white dwarf mass (1.15 M⊙) and accreted envelope (3.2 × 10⁻⁵ M⊙; 350 km) to specifically address the effect of the composition of the underlying substrate. The increase with time of the mean envelope metallicity is shown in Fig. 4. A higher metallicity was reached with an ONe-rich (Z ~ 0.129) than with a CO-rich substrate (Z ~ 0.078). Although an extensive analysis of mixing with ONe vs. CO white dwarfs would require a large set of multidimensional simulations for different masses (a project we are currently undertaking), the current paper demonstrates that the longer duration of the thermonuclear runaway, caused by the lower 12C content in an ONe-rich substrate, translates into a longer dredge-up phase that results in a higher degree of mixing.
A final aspect, the difference in final mean envelope metallicity between the 2D and 3D models with an ONe substrate, deserves further analysis. It may result, at least in part, from the different adopted white dwarf masses since their critical envelope masses and sizes also differ. Additionally, the final envelope metallicities reported here are lower limits, since the simulations were stopped before envelope-core detachment occurred. Finally, some of the difference may be caused by numerical diffusion, arising from the different resolution adopted in the 2D and 3D simulations. To perform such a survey is very computationally expensive, however, and would strongly tax currently available resources.
In summary, the 3D simulations reported here indicate that mixing with 12C-poor substrates (e.g., an ONe white dwarf; model A) lead to higher metallicities in the envelope and consequently in the ejecta. Some cautionary words must be added in this regard, however. The two multidimensional simulations reported in this work were initiated (mapped) when the temperature at the envelope base reached 108 K, neglecting the possible contribution of early mixing occurring at previous stages of the thermonuclear runaway. The possible effect of such early mixing has been investigated, however, by Glasner et al. (1997, 2007) in 2D for different choices of the initial temperature, demonstrating that all models converge to an almost universal model. The convergence in the mixing amounts in those models, including a case initiated at 7 × 10⁷ K, remained within 5%. These conclusions need to be verified in 3D.
Online material
Movie of Fig. 1 Access Supplementary Material
Movie of Fig. 1 Access Supplementary Material
Movie of Fig. 1 Access Supplementary Material
Movie of Fig. 1 Access Supplementary Material
Movie of Fig. 1 Access Supplementary Material
Radially, the envelope extends 325 km above the ONe core in model A. The outer 75 km of the underlying white dwarf have also been included in the computational domain.
See, however, Shen & Bildsten (2009) for ignition conditions in C-poor envelopes.
There may be sufficient time during this vigorous convective stage to build a fast dynamo. If so, the magnetic field could amplify before the onset of the explosion and be advected with the layer. Such magnetic fields can become very large since buoyancy is inhibited by the rapidly expanding layers. This may have important consequences for the evolution of those systems (e.g., ultra-high energy production (>100 MeV gamma-rays) during particle acceleration).
Acknowledgments
The authors would like to thank Alan Calder for many fruitful discussions and exchanges. Part of the software used in this work was developed by the DOE-supported ASC/Alliances Center for Astrophysical Thermonuclear Flashes at the University of Chicago. This work has been partially supported by the Spanish MINECO grant AYA2014–59084–P, by the E.U. FEDER funds, by the AGAUR/Generalitat de Catalunya grant SGR0038/2014, and by the U.S. Department of Energy, Office of Science, Office of Nuclear Physics. We also acknowledge the Barcelona Supercomputing Center for a generous allocation of time at the MareNostrum supercomputer.
References
- Alexakis, A., Calder, A. C., Heger, A., et al. 2004, ApJ, 602, 931 [NASA ADS] [CrossRef] [Google Scholar]
- Casanova, J., José, J., García-Berro, E., Calder, A., & Shore, S. N. 2010, A&A, 513, L5 [NASA ADS] [CrossRef] [EDP Sciences] [Google Scholar]
- Casanova, J., José, J., García-Berro, E., Calder, A., & Shore, S. N. 2011a, A&A, 527, A5 [NASA ADS] [CrossRef] [EDP Sciences] [Google Scholar]
- Casanova, J., José, J., García-Berro, E., Shore, S. N., & Calder, A. C. 2011b, Nature, 478, 490 [NASA ADS] [CrossRef] [PubMed] [Google Scholar]
- Downen, L. N., Iliadis, C., José, J., & Starrfield, S. 2013, ApJ, 762, 105 [NASA ADS] [CrossRef] [Google Scholar]
- Durisen, R. H. 1977, ApJ, 213, 145 [NASA ADS] [CrossRef] [Google Scholar]
- Fujimoto, M.-Y., & Iben, I., Jr. 1992, ApJ, 399, 646 [NASA ADS] [CrossRef] [Google Scholar]
- Fryxell, B., Olson, K., Ricker, P., et al. 2000, ApJS, 131, 273 [NASA ADS] [CrossRef] [Google Scholar]
- Gehrz, R. D., Truran, J. W., Williams, R. E., & Starrfield, S. 1998, PASP, 110, 3 [NASA ADS] [CrossRef] [Google Scholar]
- Glasner, S. A., & Livne, E. 1995, ApJ, 445, L149 [NASA ADS] [CrossRef] [Google Scholar]
- Glasner, S. A., Livne, E., & Truran, J. W. 1997, ApJ, 475, 754 [NASA ADS] [CrossRef] [Google Scholar]
- Glasner, S. A., Livne, E., & Truran, J. W. 2005, ApJ, 625, 347 [NASA ADS] [CrossRef] [Google Scholar]
- Glasner, S. A., Livne, E., & Truran, J. W. 2007, ApJ, 665, 1321 [NASA ADS] [CrossRef] [Google Scholar]
- Glasner, S. A., Livne, E., & Truran, J. W. 2012, MNRAS, 427, 2411 [NASA ADS] [CrossRef] [Google Scholar]
- Glasner, S. A., Livne, E., & Truran, J. W. 2014, in Stella Novae: Past and Future Decades, eds. P. A. Woudt, & V. A. R. M. Ribeiro (San Francisco: ASP Conf. Ser.), 295 [Google Scholar]
- Iben, I., Jr., Fujimoto, M.-Y., & MacDonald, J. 1991, ApJ, 375, L27 [NASA ADS] [CrossRef] [Google Scholar]
- Iben, I., Jr., Fujimoto, M.-Y., & MacDonald, J. 1992, ApJ, 388, 521 [NASA ADS] [CrossRef] [Google Scholar]
- Iliadis, C., Longland, R., Champagne, A. E., Coc, A., & Fitzgerald, R. 2010, Nucl. Phys. A, 841, 31 [NASA ADS] [CrossRef] [Google Scholar]
- José, J. 2016, Stellar Explosions: Hydrodynamics and Nucleosynthesis (CRC/Taylor and Francis: Boca Raton) [Google Scholar]
- José, J., & Hernanz, M. 1998, ApJ, 494, 680 [NASA ADS] [CrossRef] [Google Scholar]
- José, J., & Shore, S. 2008, in Classical Novae, eds. M. F. Bode, & A. Evans (Cambridge: Cambridge Univ. Press), 121 [Google Scholar]
- Kercek, A., Hillebrandt, W., & Truran, J. W. 1998, A&A, 337, 379 [NASA ADS] [Google Scholar]
- Kercek, A., Hillebrandt, W., & Truran, J. W. 1999, A&A, 345, 831 [NASA ADS] [Google Scholar]
- Kippenhahn, R., & Thomas, H.-C. 1978, A&A, 63, 265 [NASA ADS] [Google Scholar]
- Kovetz, A., & Prialnik, D. 1985, ApJ, 291, 812 [NASA ADS] [CrossRef] [Google Scholar]
- Kovetz, A., & Prialnik, D. 1997, ApJ, 477, 356 [NASA ADS] [CrossRef] [Google Scholar]
- Kutter, G. S., & Sparks, W. M. 1987, ApJ, 321, 386 [NASA ADS] [CrossRef] [Google Scholar]
- Kutter, G. S., & Sparks, W. M. 1989, ApJ, 340, 985 [NASA ADS] [CrossRef] [Google Scholar]
- Lesieur, M., Yaglom, A., & David, F. 2001, New Trends in Turbulence, Les Houches 2000 Summer School (Berlin: Springer-Verlag), 74 [Google Scholar]
- Livio, M., & Truran, J. W. 1987, ApJ, 318, 316 [NASA ADS] [CrossRef] [Google Scholar]
- Livio, M., & Truran, J. W. 1990, Proc. 5th Florida Workshop in Nonlinear Astronomy, 617, 126 [Google Scholar]
- MacDonald, J. 1983, ApJ, 273, 289 [NASA ADS] [CrossRef] [Google Scholar]
- Pope, S. B. 2000, Turbulent Flows (Cambridge: Cambridge Univ. Press) [Google Scholar]
- Porter, J. M., OBrien, T. J., & Bode, M. F. 1998, MNRAS, 296, 943 [NASA ADS] [CrossRef] [Google Scholar]
- Prialnik, D., & Kovetz, A. 1984, ApJ, 281, 367 [NASA ADS] [CrossRef] [Google Scholar]
- Ritossa, C., García-Berro, E., & Iben, I., Jr. 1996, ApJ, 460, 489 [NASA ADS] [CrossRef] [Google Scholar]
- Rosner, R., Alexakis, A., Young, Y., Truran, J. W., & Hillebrandt, W. 2001, ApJ, 562, L177 [NASA ADS] [CrossRef] [Google Scholar]
- Shara, M. M. 1982, ApJ, 261, 649 [NASA ADS] [CrossRef] [Google Scholar]
- Shen, K., & Bildsten, L. 2009, ApJ, 692, 324 [NASA ADS] [CrossRef] [Google Scholar]
- Shore, S. N. 2007, Astrophysical Hydrodynamics: An Introduction (Wiley: Darmstadt) [Google Scholar]
- Shore, S. N., Starrfield, S., Ake, T. B., III, & Hauschildt, P. H. 1997, ApJ, 490, 393 [NASA ADS] [CrossRef] [Google Scholar]
- Sparks, W. M., & Kutter, G. S. 1987, ApJ, 321, 394 [NASA ADS] [CrossRef] [Google Scholar]
- Starrfield, S., Truran, J. W., Wiescher, M., & Sparks, W. 1998, MNRAS, 296, 502 [NASA ADS] [CrossRef] [Google Scholar]
- Starrfield, S., Iliadis, C., & Hix, W. R. 2008, in Classical Novae, eds. M. F. Bode, & A. Evans (Cambridge: Cambridge Univ. Press), 77 [Google Scholar]
- Starrfield, S., Iliadis, C., Hix, W. R., Timmes, F. X., & Sparks, W. M. 2009, ApJ, 692, 1532 [NASA ADS] [CrossRef] [Google Scholar]
- Starrfield, S., Iliadis, C., & Hix, W. R. 2016, PASP, in press [Google Scholar]
- Vaytet, N. M. H., OBrien, T. J., & Rushton, A. P. 2007, MNRAS, 380, 175 [NASA ADS] [CrossRef] [Google Scholar]
- Woosley, S. E. 1986, in Nucleosynthesis and Chemical Evolution, eds. B. Hauck, A. Maeder, & G. Meynet (Geneva Observatory: Sauverny), 1 [Google Scholar]
- Yaron, O., Prialnik, D., Shara, M. M., & Kovetz, A. 2005, ApJ, 623, 398 [NASA ADS] [CrossRef] [Google Scholar]
- Zingale, M., Dursi, L. J., ZuHone, J., et al. 2002, ApJS, 143, 539 [NASA ADS] [CrossRef] [Google Scholar]
All Figures
|
Fig. 1 Snapshots of the early development and growth of buoyant fingering for model A (t = 130 s; upper panel) and model B (t = 40 s; lower panel), shown in terms of 20Ne and 12C mass fractions, respectively, in logarithmic scale. The two snapshots correspond to 2D slices on the xz plane, taken at y = 4 × 107 cm. In both models, the initial buoyant fingering appears within the first 50 s, although it lasts longer (up to 170 s) in model A. See movies. |
| In the text | |
|
Fig. 2 Snapshots of the development of the convective front in model A, at t = 437 s (upper panel), 635 s (central panel), and 709 s (lower panel), shown in terms of the 20Ne mass fraction, in logarithmic scale. Snapshots correspond to 2D slices on the xz plane, taken at y = 4 × 107 cm. The dredge-up of fresh material from the outer core, driven by Kelvin-Helmholtz instabilities, translates into a mean metallicity in the envelope of 0.211, 0.234, and 0.241, respectively. The mean metallicity at the end of the simulation reaches 0.246, by mass, for this model. |
| In the text | |
|
Fig. 3 Abundance distribution of 15O at the beginning (blue) and end (t = 751 s; red) of the simulation in model A. The histograms contain about 24 500 points from a 100 km thick layer, located well above the core-envelope interface (~150 km). The initially narrow and discrete distribution eventually evolves into an inhomogeneous distribution that fits a Gaussian with a dispersion of 25% in the mean value. |
| In the text | |
|
Fig. 4 Time-evolution of the mean metallicity of the envelope in the 2D models with underlying CO (solid line) and ONe white dwarfs (dashed line). |
| In the text | |
Current usage metrics show cumulative count of Article Views (full-text article views including HTML views, PDF and ePub downloads, according to the available data) and Abstracts Views on Vision4Press platform.
Data correspond to usage on the plateform after 2015. The current usage metrics is available 48-96 hours after online publication and is updated daily on week days.
Initial download of the metrics may take a while.