Fig. 3
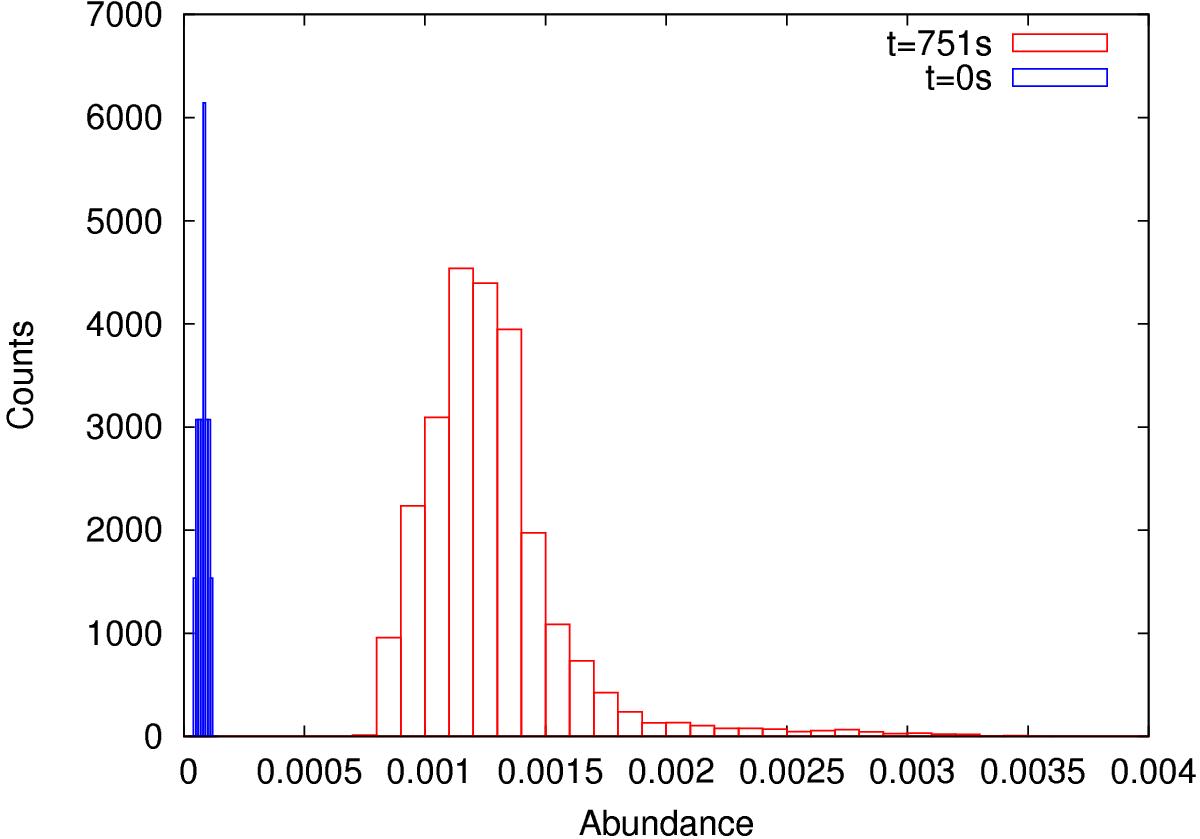
Abundance distribution of 15O at the beginning (blue) and end (t = 751 s; red) of the simulation in model A. The histograms contain about 24 500 points from a 100 km thick layer, located well above the core-envelope interface (~150 km). The initially narrow and discrete distribution eventually evolves into an inhomogeneous distribution that fits a Gaussian with a dispersion of 25% in the mean value.
Current usage metrics show cumulative count of Article Views (full-text article views including HTML views, PDF and ePub downloads, according to the available data) and Abstracts Views on Vision4Press platform.
Data correspond to usage on the plateform after 2015. The current usage metrics is available 48-96 hours after online publication and is updated daily on week days.
Initial download of the metrics may take a while.