Fig. 6
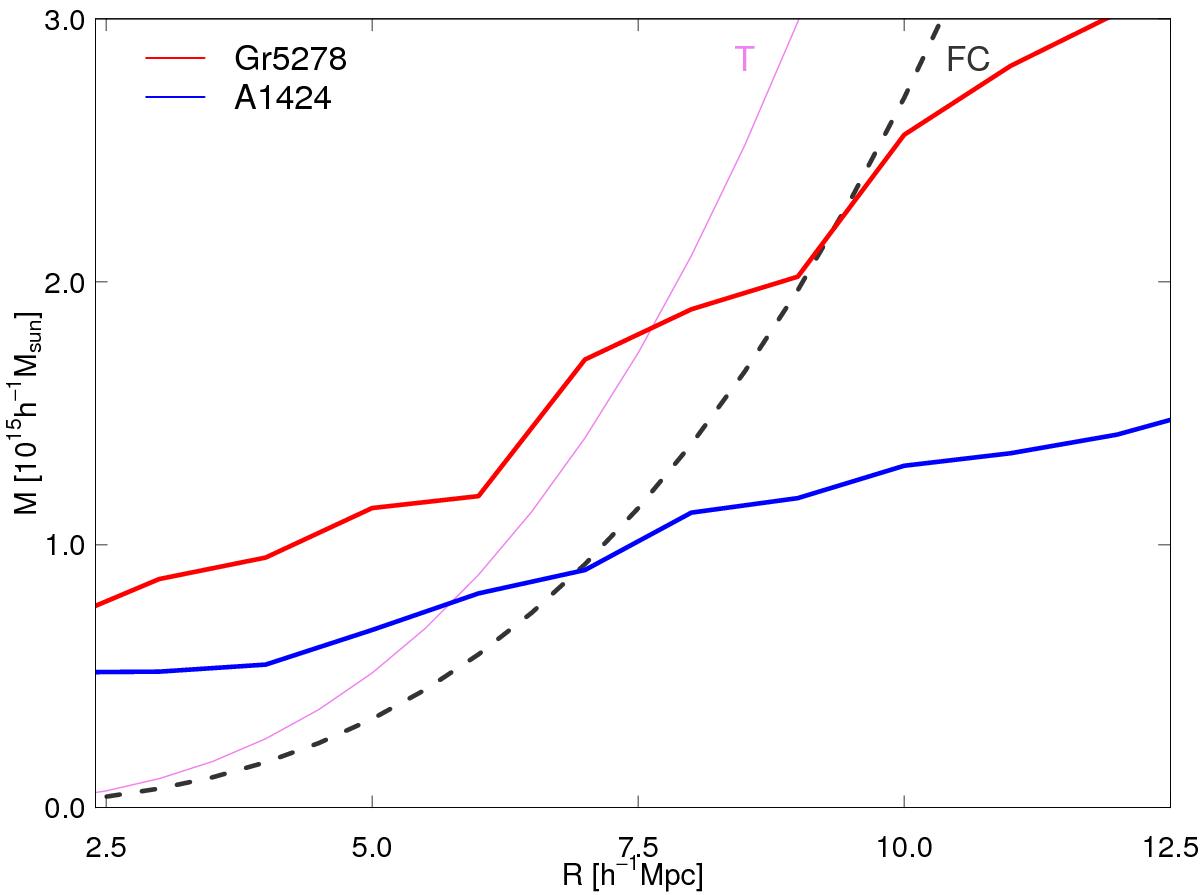
Mass-radius relation for the high-density cores in the supercluster SCl 019. Violet line shows the embedded mass M versus radius of a sphere R for the turnaround T, and the dashed grey line shows the future collapse FC. The red line shows the embedded mass versus radius for the region around the cluster Gr5278, the blue line shows the region around the cluster A1424.
Current usage metrics show cumulative count of Article Views (full-text article views including HTML views, PDF and ePub downloads, according to the available data) and Abstracts Views on Vision4Press platform.
Data correspond to usage on the plateform after 2015. The current usage metrics is available 48-96 hours after online publication and is updated daily on week days.
Initial download of the metrics may take a while.