Fig. 5
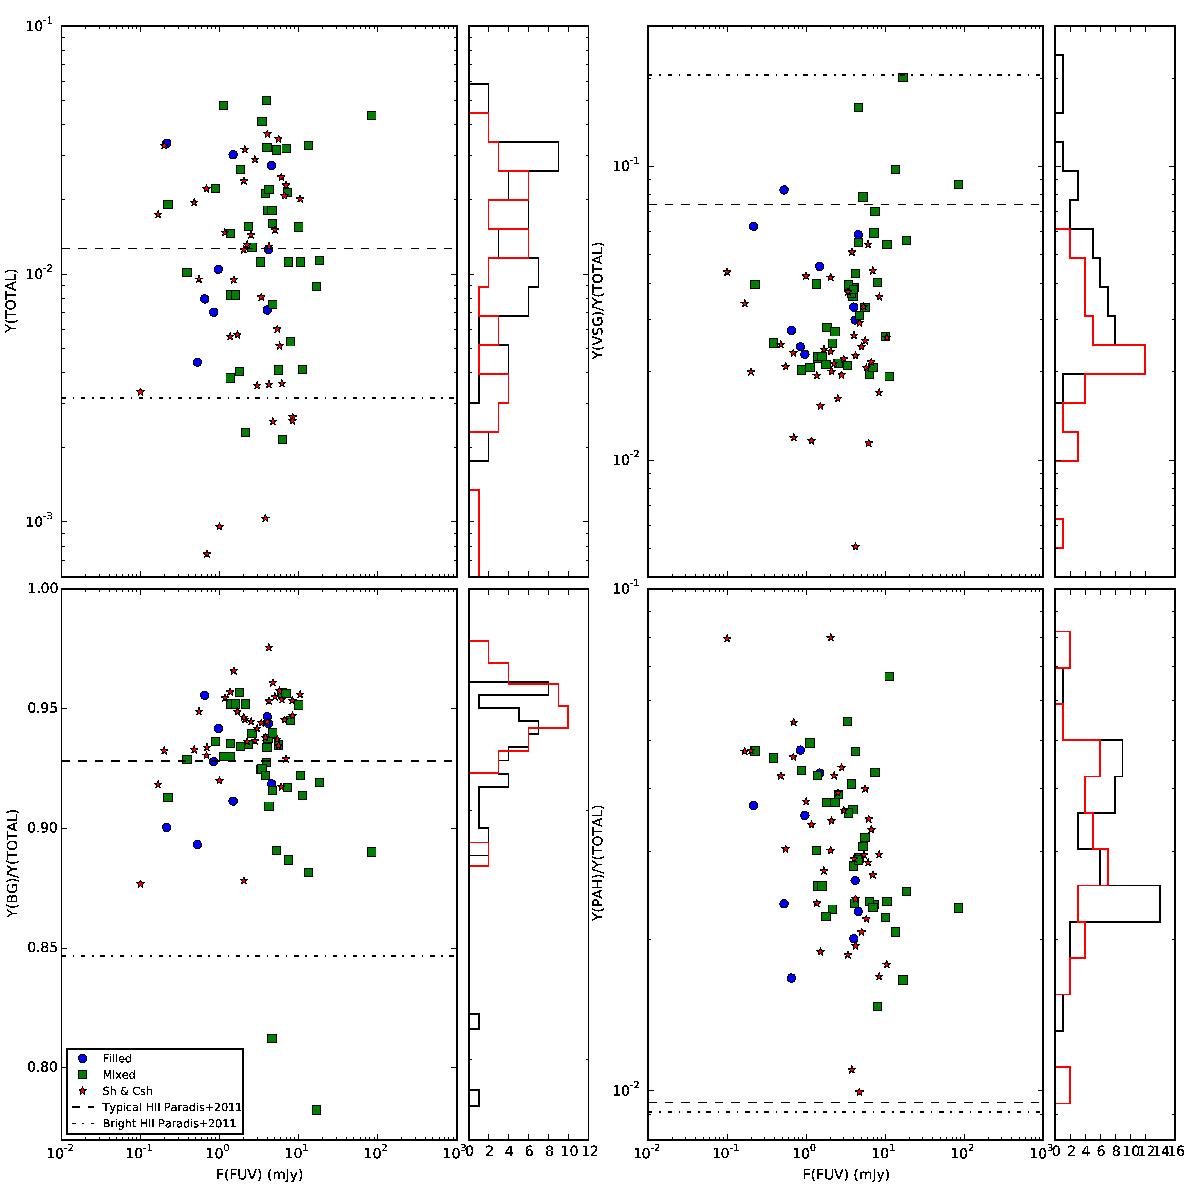
Dust mass abundances obtained from fitting the SED of each region using a 4 Myr ISRF and Compiegne dust model. Only fits with a ![]() are taken into account. Blue circles are filled regions, green squares mixed ones, and red triangles shells or clear shells. Dashed and dashed-dotted lines correspond to the values obtained by Paradis et al. (2011), who separated between typical H ii regions and regions being significantly brighter at Hα: for typical (dashed line) and bright (dot-dashed line) H ii regions in the LMC modelled assuming a 4 Myr star cluster ISRF and the Desert dust model. Mean values of the relative errors in the data presented in the figures are 11%, 19%, 16%, and 23% for top left, top right, bottom left and bottom right panels, respectively. Black histograms correspond to the filled and mixed regions and red ones to the shells or clear shells regions.
are taken into account. Blue circles are filled regions, green squares mixed ones, and red triangles shells or clear shells. Dashed and dashed-dotted lines correspond to the values obtained by Paradis et al. (2011), who separated between typical H ii regions and regions being significantly brighter at Hα: for typical (dashed line) and bright (dot-dashed line) H ii regions in the LMC modelled assuming a 4 Myr star cluster ISRF and the Desert dust model. Mean values of the relative errors in the data presented in the figures are 11%, 19%, 16%, and 23% for top left, top right, bottom left and bottom right panels, respectively. Black histograms correspond to the filled and mixed regions and red ones to the shells or clear shells regions.
Current usage metrics show cumulative count of Article Views (full-text article views including HTML views, PDF and ePub downloads, according to the available data) and Abstracts Views on Vision4Press platform.
Data correspond to usage on the plateform after 2015. The current usage metrics is available 48-96 hours after online publication and is updated daily on week days.
Initial download of the metrics may take a while.