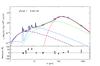
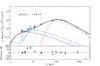
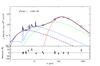
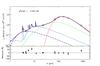
Fig. C.1
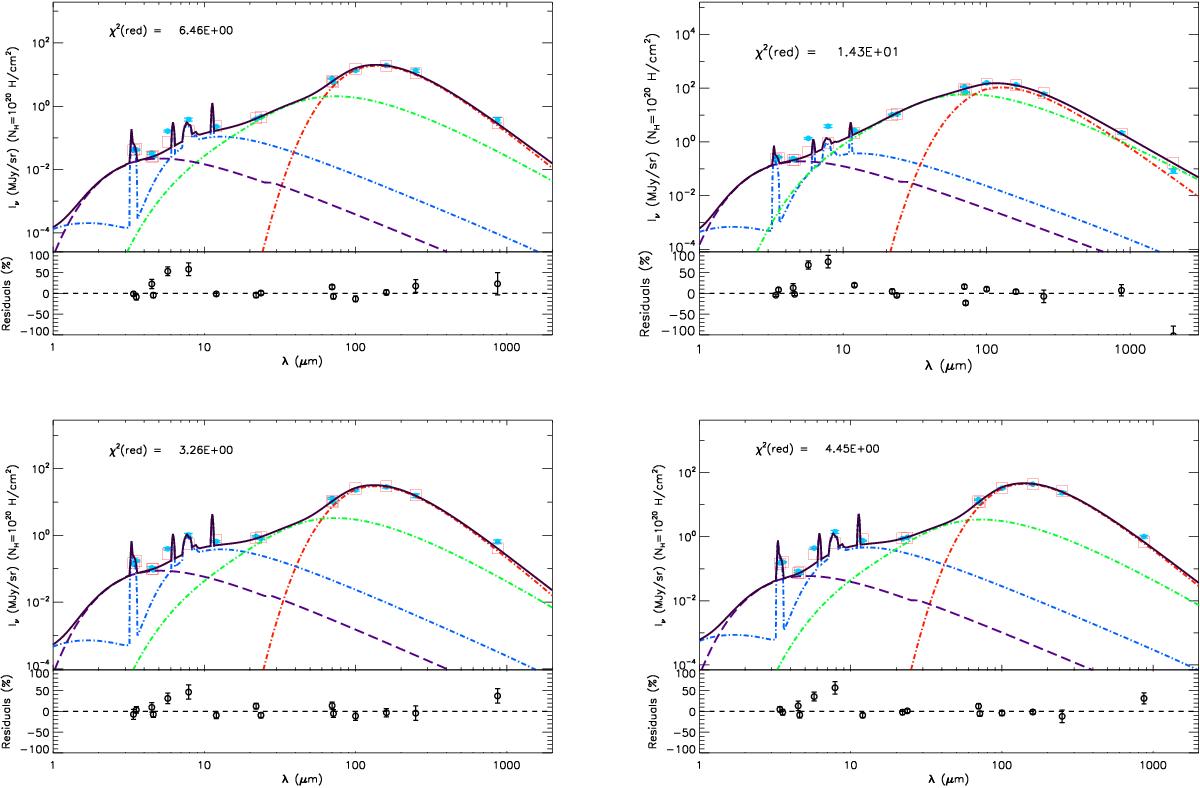
SED fittings for the 4 regions shown in Fig. 4 but fitted with a 4 Myr star cluster ISRF and Desert dust model. Light blue points: observed data with the errors, red squares: modelled broad-band fluxes, dashed-dot blue line: PAH emission, dashed-dot green line: VSG emission, dashed-dot red line: BG emission and dashed purple line: NIR continuum. The SED is well fitted at most bands except in the 6–9 μm wavelength range where the Desert dust model under-predicts the PAH emission.
Current usage metrics show cumulative count of Article Views (full-text article views including HTML views, PDF and ePub downloads, according to the available data) and Abstracts Views on Vision4Press platform.
Data correspond to usage on the plateform after 2015. The current usage metrics is available 48-96 hours after online publication and is updated daily on week days.
Initial download of the metrics may take a while.