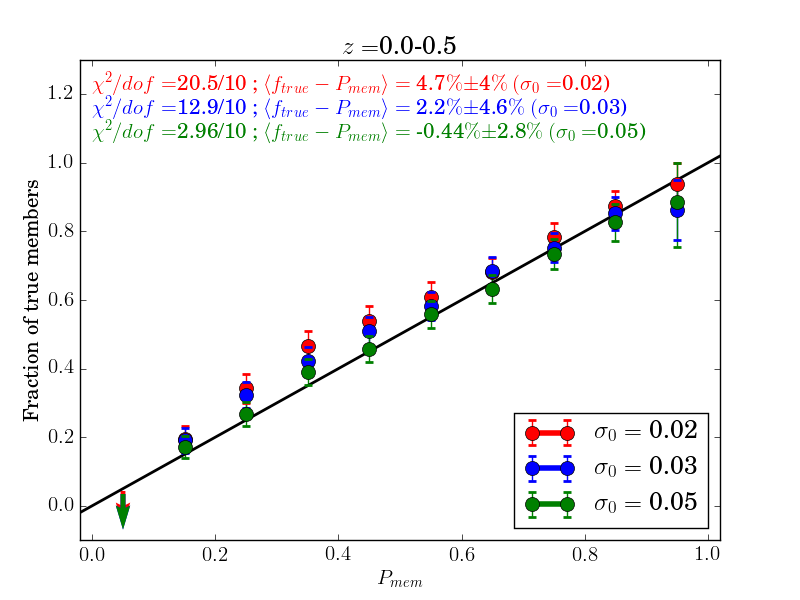
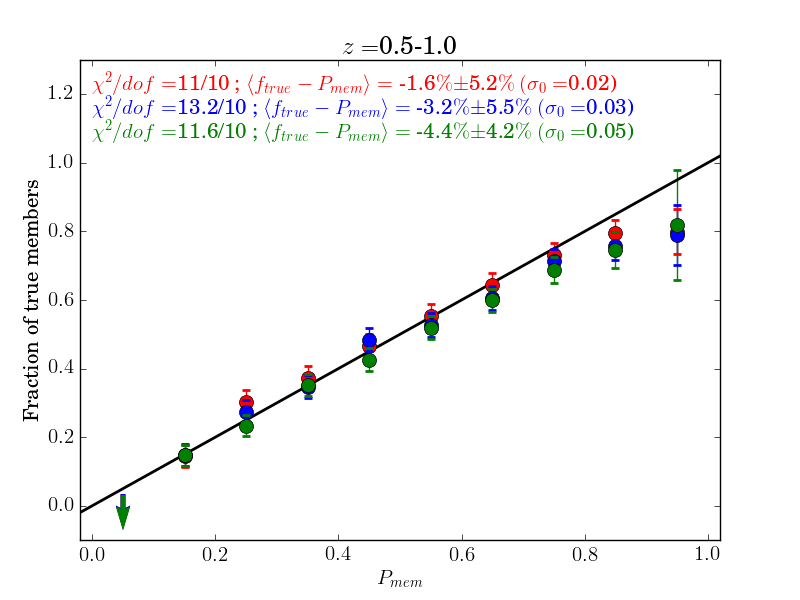
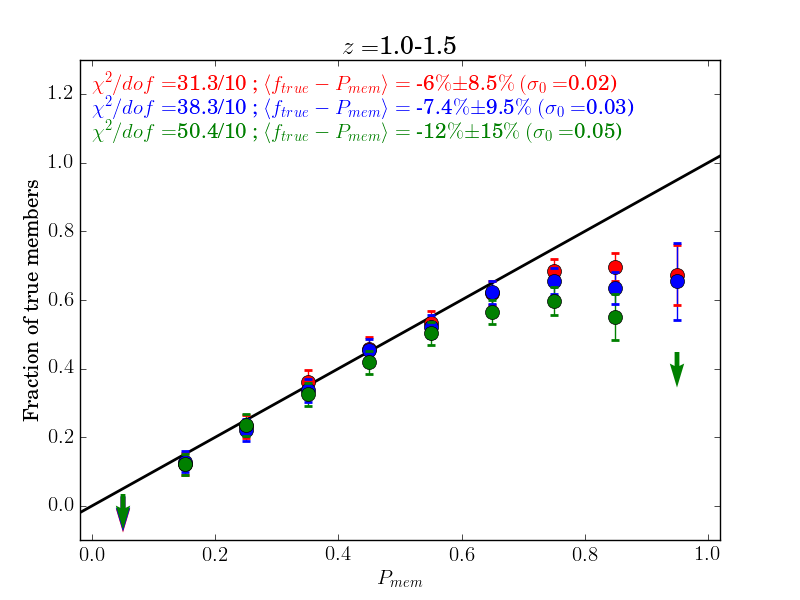
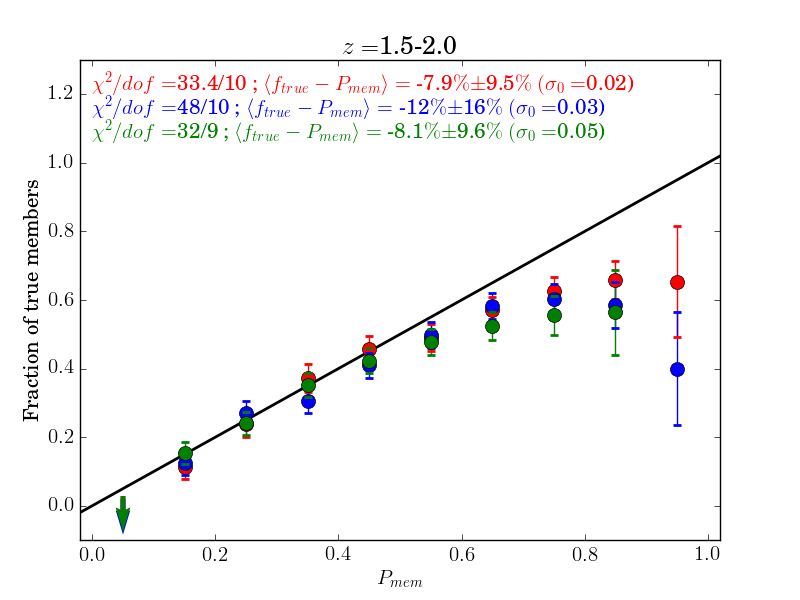
Fig. 8
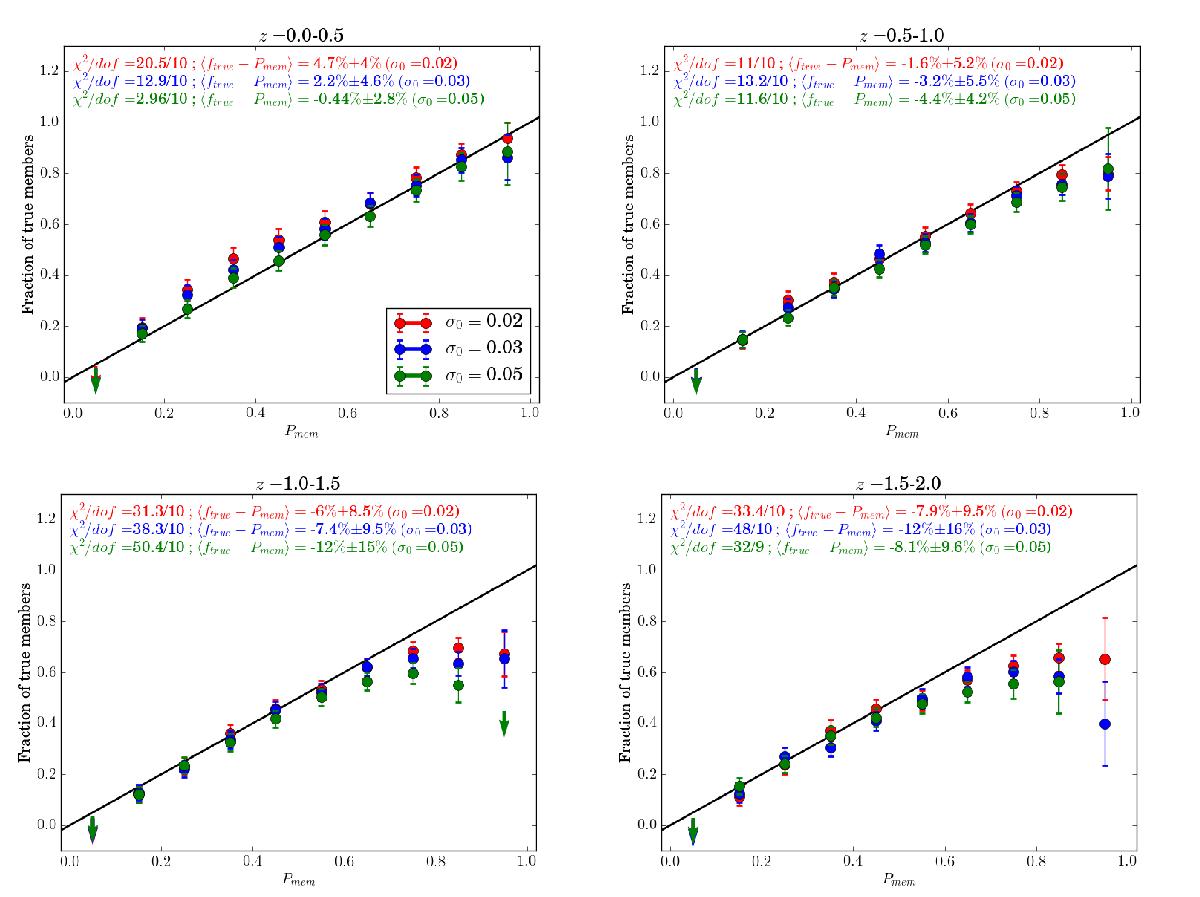
Fraction of true cluster members (ftrue, y-axis) for galaxies brighter than H∗(zp) + 1.5 which membership probabilities (Pmem) reported in the x-axis are assigned to. Points are associated with at least five sources per bins. See Legend in the top left panel for the color code adopted. Different colors refer to different statistical redshift accuracy σ(z) = σ0(1 + z). Mean values and Poisson uncertainties added in quadrature to δftrue = 3% are reported. Upper limits are at 2σ level. Different panels refer to different redshift intervals. At the top of each panel the reduced χ2, the mean difference ⟨ ftrue−Pmem ⟩, and the rms dispersion around the mean are reported. Upper limits are considered as true measurements when estimating ⟨ ftrue−Pmem ⟩.
Current usage metrics show cumulative count of Article Views (full-text article views including HTML views, PDF and ePub downloads, according to the available data) and Abstracts Views on Vision4Press platform.
Data correspond to usage on the plateform after 2015. The current usage metrics is available 48-96 hours after online publication and is updated daily on week days.
Initial download of the metrics may take a while.