Fig. 5
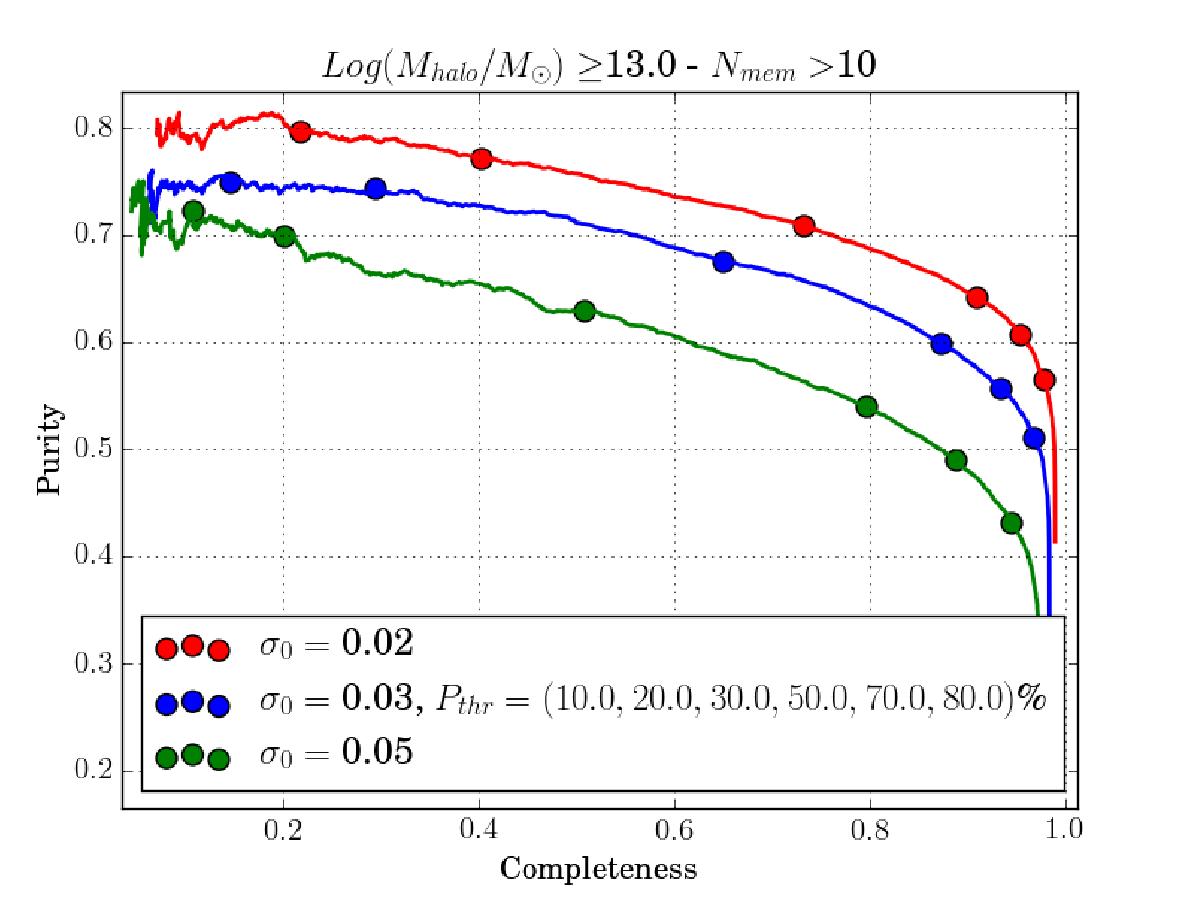
Purity vs. completeness mean values for the membership assignments. For each cluster galaxies brighter than H∗(zp) + 1.5 and with a projected distance from the cluster center not greater than r200 are considered. Different colors refer to different statistical redshift accuracy σ(z) = σ0(1 + z). Dots show the mean values of both completeness and purity for galaxies with Pmem>Pthr, as indicated in the label. Pthr increases from the right to the left. The errors in the mean values are within the dot size.
Current usage metrics show cumulative count of Article Views (full-text article views including HTML views, PDF and ePub downloads, according to the available data) and Abstracts Views on Vision4Press platform.
Data correspond to usage on the plateform after 2015. The current usage metrics is available 48-96 hours after online publication and is updated daily on week days.
Initial download of the metrics may take a while.