| Issue |
A&A
Volume 595, November 2016
|
|
|---|---|---|
| Article Number | A49 | |
| Number of page(s) | 9 | |
| Section | Interstellar and circumstellar matter | |
| DOI | https://doi.org/10.1051/0004-6361/201527897 | |
| Published online | 26 October 2016 | |
Colliding interstellar bubbles in the direction of l = 54°
1 Department of Theoretical Physics and
AstrophysicsFaculty of Science, Masaryk University, Kotlářská 2, 611 37 Brno, Czech Republic
e-mail: This email address is being protected from spambots. You need JavaScript enabled to view it.
2 Astronomical Institute, Academy of Sciences of the Czech
Republic, Boční II 1401, 141 31 Prague 4, Czech Republic
Received:
4
December
2015
Accepted:
31
August
2016
Abstract
Context. Interstellar bubbles are structures in the interstellar medium with diameters of a few to tens of parsecs. Their progenitors are stellar winds, intense radiation of massive stars, or supernova explosions. Star formation and young stellar objects are commonly associated with these structures.
Aims. We compare infrared observations of bubbles N115, N116 and N117 with atomic, molecular and ionized gas in this region. While determining the dynamical properties of the bubbles, we also look into their ambient environment to understand their formation in a wider context.
Methods. To find bubbles in HI (Very Large Array Galactic Plane Survey) and CO data (Galactic Ring Survey), we used the images from the Galactic Legacy Infrared Mid-Plane Survey. We manually constructed masks based on the appearance of the bubbles in the IR images and applied them to the HI and CO data. We determined kinematic distance, size, expansion velocity, mass, original density of the maternal cloud, age, and energy input of the bubbles.
Results. We identified two systems of bubbles: the first, the background system, is formed by large structures G053.9+0.2 and SNR G054.4-0.3 and the infrared bubble N116+117. The second, the foreground system, includes the infrared bubble N115 and two large HI bubbles, which we discovered in the HI data. Both systems are independent, lying at different distances, but look similar. They are both formed by two large colliding bubbles with radii around 20–30 pc and ages of a few million years. A younger and smaller (~4 pc, less than a million years) infrared bubble lies at the position of the collision.
Conclusions. We found that both infrared bubbles N115 and N116+117 are associated with the collisions of larger and older bubbles. We propose that such collisions increase the probability of further star formation, probably by squeezing the interstellar material, suggesting that they are an important mechanism for star formation.
Key words: ISM: bubbles / ISM: clouds / HII regions / ISM: supernova remnants
© ESO, 2016
1. Introduction
The interstellar medium (ISM) in the Galaxy shows a rich variety of structures, including clumps, filaments and dense sheets. Some of the structures resemble envelopes and are known as shells or bubbles. Their (nearly) ubiquitous presence is the reason behind the term “the bubbling galactic disk” (Churchwell et al. 2006; Deharveng et al. 2010; Simpson et al. 2012), which describes the state of the ISM. Progenitors of these bubbles, which are most easily observed in the infrared band, include stellar winds, intense radiation of massive stars, or supernova explosions. Basically all infrared (IR) bubbles are found near ionized hydrogen (HII) regions, CO clouds, or other indicators of recent or on-going star formation.
The walls delineating the IR bubbles are associated with sites of new star formation, that is, they contain objects younger than the predicted age of the bubble itself – many examples can be found in Deharveng et al. (2010), suggesting triggered star formation. There are two basic mechanisms proposed to explain such triggering: collect & collapse (C&C) and radiation driven implosion (RDI). In the first one, the interstellar medium is swept up into a dense, cold layer and this layer gravitationally fragments and then forms stars. In the second scenario, the shock front compresses existing cold clumps and thus initiates the star formation.
It is difficult to distinguish between these scenarios (see, e.g. Walch et al. 2015, for the discussion of these questions connected with the IR bubble RCW 120), and there is still the possibility that no real triggering is taking place, just a shifting and relocation of material, which would also form stars without any external driver (see Dale et al. 2015, for a discussion about what triggering really means).
In this paper, we compare the IR observations of bubbles N115, N116, and N117 from Churchwell et al. (2006) with atomic (HI), molecular (CO), and ionized (radio-continuum) gas in the studied region. We find two independent subsystems, which both look very much alike: colliding bubbles with star formation taking place in the position of the collision. In the following section we first summarize what is known about the studied bubbles and then we describe the data and the methods of the analysis. Afterwards, we will describe each subsystem separately and calculate its properties. We conclude the paper with a brief discussion.
Infrared bubbles N115, N116, and N117 were identified by Churchwell et al. (2006). Radial velocities associated with these bubbles are vLSR = 24.0 km s-1 for N115 (Watson et al. 2010) and vLSR = 42.8 km s-1 for N117 (Watson et al. 2003)1; these velocities belong to the (molecular or ionized) gas associated with these bubbles.
There are two large radio objects in the vicinity of the bubbles: SNR G54.4-0.3 and a radio loop G053.9+0.2 (see Fig. 3, the left-hand panel). SNR G54.4-0.3 was studied by Junkes et al. (1992a) and found to be associated with the CO gas at around vLSR = 40.0 km s-1. The loop G053.9+0.2 was studied by Leahy et al. (2008) and was found to be related to an IR shell, which itself was connected to CO emission and HII regions with velocities around vLSR = 40.0 km s-1. The CO and the HII regions in the vicinity of the loop G053.9+0.2 were extensively studied by Xu & Ju (2014) and a connection with IR bubbles N116 and N117 was explicitly claimed (see Fig. 1 for their image of the region).
The pulsar wind nebula connected with the SNR054.1+0.3 (Green 2014) is projected to the wall of the larger radio loop but, according to Leahy et al. (2008), is not physically associated with it, as it probably lies at a different radial velocity (53 km s-1). This pulsar wind nebula is created by the young pulsar PSR J1930+1852 (the characteristic age of the pulsar is 2900 yr).
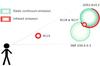 |
Fig. 1 Cartoon of the region surrounding G053.9+00.2 according to Xu & Ju (2014): N116+117 connected to the radio loop G053.9+0.2 and the independent N115 and SNR G54.4-0.3. |
2. Data and methods
2.1. Data
For our study, we use the following surveys:
-
Spitzer survey Galactic Legacy Infrared Mid-Plane Survey Extraordinaire (GLIMPSE, Benjamin et al. 2003) with a pixel resolution of 1.2′′. We use the 8.0 μm filter.
-
VLA Galactic Plane Survey (VGPS, Stil et al. 2006) for the HI and radio continuum data. The angular resolution is 1′, the channel width for HI is 1.2 km s-1.
-
Galactic Ring Survey (GRS, Jackson et al. 2006) for CO data. The angular resolution is 46′, the channel width is 0.2 km s-1.
We searched the surroundings of known IR bubbles N115, N116, and N117. N116 and N117 are listed separately in Churchwell et al. (2006), but based on their appearance and in accordance with HI, CO, and radio-continuum observations we consider them to be one physical entity (see also the discussion in Sect. 3.1). We manually constructed a ring-shaped mask (see the example in Fig. 2) based on the appearance of bubbles in the IR data (using the ds9 tool – Smithsonian Astrophysical Observatory 2000) and applied it to the HI and CO data. We searched for regions with a significant contrast between the temperature of the ring and temperatures inside and outside the ring. We also applied masks which were 25 percent wider or narrower than the original mask. However, the results did not differ significantly from each other. Such discovered regions were then inspected visually to confirm the connection between the infrared and HI or CO structures. Even though connections have been previously proposed between studied IR bubbles and the CO emission (see the Introduction), we do not use this a priori knowledge in our search to see if we will come to the same conclusions. HI data, to our best knowledge, were not studied in connection with these bubbles.
As another source of information about the distribution of the cold phase of the interstellar medium, we use “BGPS clumps” from Dunham et al. (2011). These are sources detected in the Bolocam Galactic Plane Survey (1.1 mm), which are also detected in the NH3 line by the Green Bank Telescope. Diameters of these structures lie in the range of 33′′ and 5.9′, but the objects in our studied region are smaller than 2.1′, which corresponds to linear sizes between 0.3 pc and 3 pc for our assumed distances. These sizes lie in the interval of sizes given for clumps by Bergin & Tafalla (2007), that is, objects smaller than clouds and larger than cores. That is why we adopt the name “BGPS clumps” for these tracers of the dense gas.
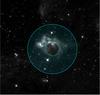 |
Fig. 2 The example of a mask for a case of the bubble F (=IR bubble N115). |
Measured properties of the studied bubbles: positions, radial velocities, and diameters, together with wavelengths, where the bubble is nicely seen or where it was previously detected and described.
2.2. Determination of bubbles properties
Knowing the line-of-sight velocity of a bubble, we compute its kinematic distance using the flat rotation curve (R⊙ = 8.5 kpc, V⊙ = 220 km s-1).
We derive masses of its atomic and molecular component by using formulas from Rohlfs & Wilson (1996). The neutral hydrogen column density NHI is derived by: 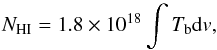 (1)where Tb is the observed brightness temperature of the HI line.
The 13CO column density  is derived by:
 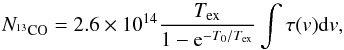 (2)where Tex is the excitation temperature, which we assume to be 30 K. T0 for the frequency 110 GHz of the 13CO (J = 1–0) is 5.3 K. τ is the optical depth derived by the formula
 ![Mathematical equation: \begin{equation} \tau = -\ln \left[1 - \frac{T_{\mathrm{b}}}{T_0} \left[(\mathrm{e}^{T_0/T_{\mathrm{ex}}}-1)^{-1} - (\mathrm{e}^{T_0/T_{\mathrm{CMB}}}-1)^{-1} \right]^{-1}\right] , \label{eq:tau} \end{equation}](/articles/aa/full_html/2016/11/aa27897-15/aa27897-15-eq35.png) (3)where Tb is the observed brightness temperature of the CO line and TCMB is the cosmic mikrowave background temperature of 2.7 K. The GRS survey provides maps of the antenna temperature TA, which has to be converted to the brightness temperature: Tb = TA/ηMB, where ηMB = 0.48.
(3)where Tb is the observed brightness temperature of the CO line and TCMB is the cosmic mikrowave background temperature of 2.7 K. The GRS survey provides maps of the antenna temperature TA, which has to be converted to the brightness temperature: Tb = TA/ηMB, where ηMB = 0.48.
Using the sizes and column densities, we calculate the original density of the medium into which the bubble expanded. We give results for HI and CO separately.
Knowing the radius r of the bubble and its expansion velocity vexp, we can compute its age (Chevalier 1994) texp as  (4)where α = 3 / 5 applies to bubbles created by a continuous supply of energy from an OB association and α = 2 / 5 to bubbles created by a one-time abrupt supernova explosion.
We estimate the total energy input Etot needed to create the bubble using the Chevalier’s formula:  (5)where n is the derived density in the vicinity of the bubble.
We compare our estimates of energies and ages with stellar models (Schaller et al. 1992) and try to derive the masses of the progenitor stars.
3. Results
Based on analysis of both the HI and CO data we found, in agreement with previous observations, that infrared bubbles N115 and N116+117 lie at different radial velocities and thus at different distances from us. The bubble N116+117, which has a radial velocity around vlsr ≃ 40 km s-1, was assumed to be connected to a larger radio continuum bubble (Xu & Ju 2014). We confirmed this and also believe that it is in fact connected to both radio bubbles seen in this direction. We also found that the bubble N115 (vlsr ≃ 24 km s-1) has two larger accompanying bubbles best visible in HI gas.
The radial velocity of 40 km s-1 is close to the terminal velocity in the direction of l = 54° and therefore we place the N116+117 system at the tangential point corresponding to the distance of 5 kpc. The velocity 24 km s-1 has both near and far kinematic distances. In accordance with most other authors (and also for reasons given below), we adopt the near distance as more appropriate. Therefore we call the system with a radial velocity of 24 km s-1, containing the infrared bubble N115, the foreground system, and the system with a radial velocity of 40 km s-1, the background system.
Table 1 gives an overview of the bubbles identified in the area, their positions, and alternate names. Table 2 summarizes their dimensions, derived masses and densities (Eqs. (1)–(3)), and energies involved in their creation (Eq. (5)).
Properties of identified bubbles.
3.1. Background system
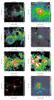 |
Fig. 3 Multiwavelength image of the background system (left: the total system, right: the small central region. Positions of bubbles A (upper right), B (lower left), and C (small in the middle) are overlaid. The HI is summed over the velocity interval: 38.9 km s-1<vLSR< 42.2 km s-1 (left) and 39.8 km s-1<vLSR< 42.2 km s-1 (right), the CO over the interval: 38.6 km s-1<vLSR< 41.6 km s-1 (left) and 38.4 km s-1<vLSR< 41.8 km s-1 (right). Crosses in the CO pictures belong to the BGPS clumps found at the corresponding velocity intervals. |
The background system, centred around the IR bubble N116+117 at the radial velocity of ~40 km s-1, lies at a distance of approximately 5 kpc. For the purposes of the description, we will name the larger bubbles of this system as A and B, and the smaller bubble (which is coincident with the IR bubble N116+117) as C. The diameter of the small bubble C in the Figures (and its typical size in all studied spectral regions) is 5′; the diameters of A and B are 39′ and 45′, respectively. In linear dimensions, C corresponds to 7 pc, A to 56 pc, and B to 65 pc.
In the infrared emission (8 μm) the small bubble C is described by Churchwell et al. (2006) as two bipolar bubbles, one incomplete (N116) and one closed (N117). Details can be found in Fig. 3, the right-hand part. Also larger bubble A is observable in this spectral region as an incomplete ring surrounding a region devoid of any extended emission (Fig. 3, the upper panel the left-hand part; the brightest emission in the wall of A rightward from C does not belong to this system; it is N115 and belongs to the foreground system). Bubble B has no clear counterpart in the IR region.
All three bubbles are visible in the radio-continuum image. C is the brightest one, with the radio-continuum filling the interior of the infrared structure. A is visible as the closed irregular ring. B forms the incomplete but well defined spherical ring (Fig. 3, the second panel, the left-hand part).
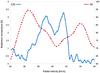 |
Fig. 4 CO (a solid blue line, the left y-axis) and HI (a dashed red line, the right y-axis) spectrum of bubble C (the background system). The HI spectrum is taken at the position (54.087°, −0.068°), the CO spectrum at the position (54.123°, −0.103°). |
The bubble best visible in the HI emission is small C. It is a small hole, which is filled by the radio-continuum emission (Fig. 3, the right-hand half). The hole is surrounded by a fragmented, denser wall. If the structure has expanded at all, its expansion velocity is small, around 4 km s-1. Bubbles A and B are not visible, or at least not visible with sufficient credibility. The region is complex and full of arcs, loops, and holes, and therefore one can easily see things which are not there. However, there is a suspicious coincidence of HI deficiency and the radio-continuum emission at the upper-right part of the wall in bubble A and the HI emission just next to this deficiency, corresponding to the IR emission (Fig. 3, upper three panels on the left-hand side). We are unable to measure the expansion velocity of bubble B, therefore we take it from Park et al. (2013), and we estimate the expansion velocity of A based on the mentioned structure.
The brightest CO emission at around ~40 km s-1 lies very near to bubble C. The bubble itself does not lie in the centre of the emission but at its edge (Fig. 3). Interesting CO arcs protrude from this bright region (they merge at bubble C). They follow the general direction of the radio-continuum emission. Walls of all three bubbles contain cold molecular clumps (BGPS clumps = crosses in the lowest panels in Fig. 3). Figure 4 shows the spectrum through the centre of bubble C (HI) and through the brightest CO emission inside the bubble (CO). HI expansion velocity is larger than CO expansion velocity, which we mostly ascribe to the off-centre position of the CO spectrum.
It appears to be that we observe two colliding bubbles. These bubbles (A and B) are seen as rings of warm ionized gas. The bubbles probably interact with neutral gas around them, as seen in the distribution of cold molecular gas (in walls) and also partly in the IR emission of the heated dust and the HI emission of atomic gas. Linear radii of these bubbles are around 30 pc. In the region where these two bubbles collide, there is another, much smaller bubble, which is compact, with walls made from neutral gas and partly traced also by molecular gas. This small bubble (C) is filled with ionized gas.
Using Eqs. (1)–(5)we calculated masses of individual bubbles (around 105 M⊙ for A and B and about a third for C), the energies needed to create the structures, and their ages (2 Myr for A and 0.5 Myr for C). We used the density nHI derived from the HI measurements, which means that this number is a lower limit for the energy, especially for small bubble C where the volume filling factor of dense molecular gas is quite high. We did not measure the expansion velocity of B; if we take the value from Park et al. (2013) we get the age of 0.3 Myr. This age is too young for bubble B to be able to create small bubble C by a collision with bubble A. However, from Junkes et al. (1992b) and Park et al. (2013), it seems plausible that this supernova evolved inside the stellar-wind bubble (and still resides inside it) and therefore the older stellar bubble is the one which collided with bubble A.
All calculated values can be found in Table 2. Energies involved in the creation of bubbles A and B are quite high (~4 × 1050 erg for A and ~2.6 × 1051 erg for B). This is not surprising for bubble B, which is a supernova remnant, but even bubble A is quite energetic. It could be an old supernova remnant (Leahy et al. 2008), but the needed energy could be supplied by stars; in this case, however, either a very massive star or several less massive would be needed. Bubble C is much less energetic and it can be easily powered by the stellar wind of a star, which is able to ionize its surroundings.
3.2. Foreground system
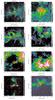 |
Fig. 5 Multiwavelength image of the foreground system (left: the total system, right: the small central region). Positions of bubbles D (upper left), E (lower right) and F (small in the middle) are overlaid. The HI is summed over the velocity interval: 23.3 km s-1<vLSR< 24.9 km s-1 (left) and 23.3 km s-1<vLSR< 24.1 km s-1 (right), the CO over the interval: 23.8 km s-1<vLSR< 25.0 km s-1 and 23.9 km s-1<vLSR< 24.8 km s-1 . Crosses in the CO pictures belong to the BGPS clumps found at the corresponding velocity intervals. |
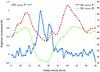 |
Fig. 6 CO (solid blue line, the left y-axis) and HI (dashed red line, the right y-axis) spectrum of bubble F (the foreground system). The HI spectrum is taken at the position (53.573°, −0.059°), the CO spectrum at the position (53.558°, 0.003°). The HI spectrum of bubble D (dotted green line) is overlaid, its position is (53.56°, −0.014°). |
The foreground system, centred around the IR bubble N115 at the radial velocity of ~24 km s-1, lies at a distance of approximately 2.1 kpc. Looking at the 3rd panels of Fig. 5, we see that it contains not only the small central bubble, but also two larger ones. We name the larger bubbles of this system as D and E, and the smaller bubble (which is coincident with the IR bubble N115) as F. The diameter of small bubble F in the Figures (and its typical size in all studied spectral regions) is 13′; the diameters of D and E (more precisely, the geometrical means of their axes) are 1.3° and 0.9°, respectively. For the near kinematic distance, which is our adopted distance, these values correspond to 8 pc (F), 46 pc (D), and 34 pc (E). At the far kinematic distance (8 kpc), sizes of the larger bubbles D and E would be around 140 pc. Such values are comparable to the thickness of the HI disk, but we see (Fig. 5, left) that the bubbles are both located inside the disk and are not influenced by the density gradient in the vertical direction. That is the other reason, apart from wanting to be on a safe, lower energetics, side, why we prefer the near kinematic distance.
In the infrared emission (8 μm) the only clearly visible object is the small bubble F (the IR bubble N115). Churchwell et al. (2006) describe it as a closed ring (see Fig. 5, the upper panel on the right-hand side). A very faint IR emission might be connected to the right-lower wall of bubble D.
Bubble F is also seen in the radio-continuum image. A not very bright emission comes from the interior of the bubble. There might be small and faint regions of ionized gas along the wall of bubble D and also along the upper part of bubble E (Fig. 5).
An object at coordinates l = 53.19°,b = 0.16°, visible both in the infrared and radio-continuum data, is another IR bubble, MWP1G053179+001558 (Simpson et al. 2012). According to Bronfman et al. (1996) and Anderson et al. (2009), it lies at the radial velocity 6.6 km s-1 ≤ vlsr ≤ 8.3 km s-1 and therefore does not belong to our foreground system (and also not to the background system).
The whole foreground system is well visible in the HI emission (see Fig. 5, the 3rd panel, for the channel map at around vlsr ≃ 24 km s-1, and Fig. 6 for the spectrum through the centre of bubble F). Bubble D is a hole in the HI distribution in this region, that is, it shows only the region devoid of HI but no prominent walls except where it interacts with E (and where F is located). Bubble E shows, on the contrary, a nice partial wall, or arc, in its lower part.
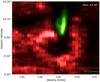 |
Fig. 7 Latitude-velocity diagram of bubble F (the foreground system) at l = 53.56°. The red colour corresponds to the HI emission, the green colour to CO. |
The brightest CO emission is connected to small bubble F (see Fig. 5, and also Fig. 7, which is the latitude-velocity diagram of the bubble and which shows how the HI and CO together surround the hot interior of the bubble and supplement each other). Molecular gas in bubbles D and E is located preferentially at the inner edge of the HI structures (it is evident especially in D). One possible scenario is that the shock wave, which created D or E, was strong enough to push the gas, but not strong enough to completely dissolve it (see Ehlerová & Palouš 2016 for an analysis of how do properties of CO clouds change with the position of clouds inside and outside HI shells). Bubbles F and E contain cold molecular clumps (BGPS clumps = crosses in the lowest panels in Fig. 5), mostly along the wall, where bubbles connect.
The picture which we see in this foreground system resembles the background one: two larger, and therefore probably older, colliding bubbles, with the region of the very recent star formation located in the interacting zone. This zone is the centre of activity of the system and is best observable in all studied wavelengths. Unlike in the previously described case, the interacting bubbles seem to be less energetic, as they are not connected to a substantial degree with ionized gas. This is confirmed by the estimates (Table 2). The ages of interacting bubbles A, B, D, and E are similar, but D and E are an order of magnitude less energetic than A.
3.3. Progenitors of bubbles
Young clusters in the studied area.
One (B) of six studied bubbles is a supernova remnant, one (A) might also be one, and the rest are created by stellar winds.
The underlying picture for both systems, the background and the foreground, needs the coeval and cospatial existence of two or more massive stars, which is indicative of the presence of the young cluster.
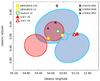 |
Fig. 8 Schematic picture of the two systems, background (smaller red one) and foreground (larger blue one) with young clusters and pulsars in the area. |
From Morales et al. (2013) we have selected young (<100 Myr) clusters in the area: Teutsch 42, [BDS2003] 12 and 156, G3CC 69 and 70. Their positions are shown in Fig. 8 (together with the schematic positions of the bubbles) and given in Table 3. From the spatial distribution, it looks like [BDS2003] 12 is connected to bubble F (IR bubble N115), [BDS2003] 156 to bubble C (N116+117), and Teutsch 42 to either bubble A or D. G3CC 69 and 70 might be connected to the infrared bubble MWP1G053179+001558 (which does not belong to any of our studied systems). Radial velocities given in Morales et al. (2013) and cited in Table 3 belong to gas associated with the clusters.
[BDS2003] 156 and 12 are both young clusters still embedded in the gas and dust envelopes (Morales et al. 2013). Their radial velocities correspond to the radial velocities of the bubbles, in which the clusters seem to lie: ([BDS2003] 156 in C = N116+117 and [BDS2003] 12 in F = N 115). The first connection is also noted by Morales et al. (2013). The unknown but young age of the cluster and its state of being still embedded in parental gas, satisfies our idea of star formation recently triggered by the colliding bubbles. The newly formed stars then create and heat the bubbles around them (C and F).
Clusters G3CC 69 and 70, also young and embedded, lie in the projected vicinity of the infrared bubble MWP1G053179+001558. However, the assumed radial velocity of this bubble is around 7 km s-1 (see Sect. 3.2 for references), and they do not seem to be physically connected, as the gas around the clusters has a radial velocity of ~23 km s-1. This velocity is the same as the velocity of the foreground system and therefore if there is any connection, it might be to this system. Still, the clusters are too young to be progenitors of the larger bubbles of the foreground system.
The last cluster in this area (Teutsch 42) is the most studied cluster of them all. There is a wide range of possible distance and age pairs for this object: 1.6 kpc and 30 Myr (Kronberger et al. 2006); 2.0 kpc and 1.3 Myr (Kharchenko et al. 2013); 6.7 kpc and 3 Myr (Morales et al. 2013); and 6.5 kpc and 2–4 Myr (Hanson et al. 2010). The paper by Hanson et al. (2010) describes photometric and spectroscopic observations of this cluster and the quoted distance is the photometric distance, which the authors claim to be in accordance with the kinematic distance (observed line-of-sight velocities of the brightest members of the cluster are large, greater than or similar to 70 km s-1, and therefore the stars are assumed to lie at the tangential point). Teutsch 42 contains a WR star and some O and B stars, and its mass is (4–6) × 103 M⊙. This age and the presence of evolved massive stars makes it a very good candidate for being the energy source of bubble A of the background system. There is still a discrepancy between measured radial velocities of stars in the cluster and gas associated with this cluster.
There are two pulsars in the area with suitable distances from the Sun: J1929+1844 (at a distance of 5.3 kpc) and J1927+1856 (4.8 kpc), Lorimer et al. (2002). One of them could be ejected from cluster Teutsch 42, but the probability depends on the distance of the cluster, which is not precisely known. It is not unusual for neutron stars to be expelled from their parental clusters, sometimes with high velocities (see Moyano Loyola & Hurley 2013). Unfortunately, at least one of these pulsars seems to be too old for the proposed young age of the cluster (J1929+1844: 8 Myr, about twice the age of Teutsch 42). The other pulsar, J1927+1856, is younger (2 Myr). But even if none of pulsars and the cluster are correlated, the stars of Teutsch 42 (or a similar cluster) are able to produce enough energy to create bubble A.
Bubble B is the supernova remnant (G54.4-0.3). Its progenitor is unknown.
Bubbles D and E have relatively low energetic demands, compatible with several (one to ten, depending on the mass) B stars.
4. Discussion
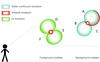 |
Fig. 9 Cartoon of the region with all previously known and newly identified bubbles. There are two systems: a foreground system (larger bubbles D and E and a small bubble F connected to the IR bubble N115); and the background system (bubbles A = a radio loop GS053.9+0.2, B = SNR G054.4-0.3 and small C = N116+117). |
Both the foreground and the background system look similar. They are formed by two bubbles, with radii around 20–30 pc and ages of a few million years, which collide. A younger and smaller bubble (~4 pc, less than a million years old) lies at the position of the collision. While this small bubble is best seen in the infrared data, it is much more visible at all studied wavelengths (IR, radio continuum, HI, CO) than the larger structures. Figure 9 shows our new, more complicated image of the area, where the interacting bubbles are depicted.
Average densities of the ISM, both corresponding to HI and CO, are higher for the smaller shells. For the bubbles with radii around 20 pc, the densities are several H cm-3 for HI and several 10 H2 cm-3 for CO. For the smaller bubbles, the density is (10–20) times higher for HI and 100 times higher for CO. This is likely to be the result of star formation taking place in the densest parts of the ISM, and as the structure created by the massive, energy-releasing star, grows, the ISM becomes less and less dense.
These two systems, though they are similar, differ especially in the amount of energy involved in their creation. The background system, the one in the vicinity of the IR bubble N116+117, is more energetic. Bubble B is a known supernova remnant (Green 2014). Bubble A might also be one: our energy estimates are high enough to be consistent with this hypothesis. But it could also be a more energetic stellar-wind-blown bubble. Other bubbles, that is, the whole foreground system, and bubble C, are probably created by stellar winds or ionizing radiation of massive stars. Energetic requirements, estimated by Eq. (5), of most of the structures can be fulfilled by one massive star. In the future, these bubbles will either merge and create larger structures (if the energy supply is sufficient), or they will soon disappear into undetectability and blend with the surroundings.
There are some young clusters in this area. At least two of them are connected to the studied bubbles: [BDS2003] 156 to small bubble C (=N116+117) and [BDS2003] 12 to small F (=N 115). Teutsch 42 might be the progenitor of bubble A (=IR loop GS053.9+0.2). The connection of our studied systems to two young clusters G3CC 69 and 70 and to three young pulsars (J1927+1856, J1929+1844, J1930+1852) in the area is unclear.
Perhaps our most interesting findings is that both infrared bubbles (N115 and N1167+117) are associated with collisions of larger and older bubbles. While we do not claim that all IR bubbles are created by collisions, these events must be important in promoting star formation. We therefore propose that such collisions increase the probability of further star formation, probably by squeezing the material and increasing its density.
In addition to the C&C or RDI scenarios, the collision driven “collect and collide”-triggered star-formation process should also be considered.
Watson et al. (2010) gives the vLSR = 18.7 km s-1 for N117, but the cited value is not found in the given reference – as also noted by Xu & Ju (2014) – and therefore we disregard it.
Acknowledgments
This study has been supported by the Czech Science Foundation grant 209/12/1795 and the MŠMT grant LG14013.
References
- Anderson, L. D., Bania, T. M., Jackson, J. M., et al. 2009, ApJS, 181, 255 [NASA ADS] [CrossRef] [Google Scholar]
- Benjamin, R. A., Churchwell, E., Babler, B. L., et al. 2003, PASP, 115, 953 [NASA ADS] [CrossRef] [Google Scholar]
- Bergin, E. A., & Tafalla, M. 2007, ARA&A, 45, 339 [NASA ADS] [CrossRef] [Google Scholar]
- Bronfman, L., Nyman, L.-A., & May, J. 1996, A&AS, 115, 81 [NASA ADS] [Google Scholar]
- Chevalier, R. A. 1994, in Supernovae, eds. S. A. Bludman, R. Mochkovitch, & J. Zinn-Justin, 743 [Google Scholar]
- Churchwell, E., Povich, M. S., Allen, D., et al. 2006, ApJ, 649, 759 [NASA ADS] [CrossRef] [Google Scholar]
- Dale, J. E., Haworth, T. J., & Bressert, E. 2015, MNRAS, 450, 1199 [NASA ADS] [CrossRef] [Google Scholar]
- Deharveng, L., Schuller, F., Anderson, L. D., et al. 2010, A&A, 523, A6 [NASA ADS] [CrossRef] [EDP Sciences] [Google Scholar]
- Dunham, M. K., Rosolowsky, E., Evans, II, N. J., Cyganowski, C., & Urquhart, J. S. 2011, ApJ, 741, 110 [NASA ADS] [CrossRef] [Google Scholar]
- Ehlerová, S., & Palouš, J. 2016, A&A, 587, A5 [NASA ADS] [CrossRef] [EDP Sciences] [Google Scholar]
- Green, D. A. 2014, Bull. Astron. Soc. India, 42, 47 [NASA ADS] [Google Scholar]
- Hanson, M. M., Kurtev, R., Borissova, J., et al. 2010, A&A, 516, A35 [NASA ADS] [CrossRef] [EDP Sciences] [Google Scholar]
- Jackson, J. M., Rathborne, J. M., Shah, R. Y., et al. 2006, ApJS, 163, 145 [NASA ADS] [CrossRef] [Google Scholar]
- Junkes, N., Fuerst, E., & Reich, W. 1992a, A&AS, 96, 1 [NASA ADS] [Google Scholar]
- Junkes, N., Fuerst, E., & Reich, W. 1992b, A&A, 261, 289 [NASA ADS] [Google Scholar]
- Kharchenko, N. V., Piskunov, A. E., Schilbach, E., Röser, S., & Scholz, R.-D. 2013, A&A, 558, A53 [NASA ADS] [CrossRef] [EDP Sciences] [Google Scholar]
- Kronberger, M., Teutsch, P., Alessi, B., et al. 2006, A&A, 447, 921 [NASA ADS] [CrossRef] [EDP Sciences] [Google Scholar]
- Leahy, D. A., Tian, W., & Wang, Q. D. 2008, AJ, 136, 1477 [Google Scholar]
- Lorimer, D. R., Camilo, F., & Xilouris, K. M. 2002, AJ, 123, 1750 [NASA ADS] [CrossRef] [Google Scholar]
- Morales, E. F. E., Wyrowski, F., Schuller, F., & Menten, K. M. 2013, A&A, 560, A76 [NASA ADS] [CrossRef] [EDP Sciences] [Google Scholar]
- Moyano Loyola, G. R. I., & Hurley, J. R. 2013, MNRAS, 434, 2509 [NASA ADS] [CrossRef] [EDP Sciences] [Google Scholar]
- Park, G., Koo, B.-C., Gibson, S. J., et al. 2013, ApJ, 777, 14 [NASA ADS] [CrossRef] [Google Scholar]
- Rohlfs, K., & Wilson, T. L. 1996, Tools of Radio Astronomy (Astronomy and Astrophysics Library) [Google Scholar]
- Schaller, G., Schaerer, D., Meynet, G., & Maeder, A. 1992, A&AS, 96, 269 [Google Scholar]
- Simpson, R. J., Povich, M. S., Kendrew, S., et al. 2012, MNRAS, 424, 2442 [NASA ADS] [CrossRef] [Google Scholar]
- Smithsonian Astrophysical Observatory 2000, SAOImage DS9: A utility for displaying astronomical images in the X11 window environment (Astrophysics Source Code Library) [Google Scholar]
- Stil, J. M., Taylor, A. R., Dickey, J. M., et al. 2006, AJ, 132, 1158 [NASA ADS] [CrossRef] [Google Scholar]
- Walch, S., Whitworth, A. P., Bisbas, T. G., Hubber, D. A., & Wünsch, R. 2015, MNRAS, 452, 2794 [NASA ADS] [CrossRef] [Google Scholar]
- Watson, C., Araya, E., Sewilo, M., et al. 2003, ApJ, 587, 714 [NASA ADS] [CrossRef] [Google Scholar]
- Watson, C., Hanspal, U., & Mengistu, A. 2010, ApJ, 716, 1478 [NASA ADS] [CrossRef] [Google Scholar]
- Xu, J.-L., & Ju, B.-G. 2014, A&A, 569, A36 [NASA ADS] [CrossRef] [EDP Sciences] [Google Scholar]
All Tables
Measured properties of the studied bubbles: positions, radial velocities, and diameters, together with wavelengths, where the bubble is nicely seen or where it was previously detected and described.
All Figures
|
Fig. 1 Cartoon of the region surrounding G053.9+00.2 according to Xu & Ju (2014): N116+117 connected to the radio loop G053.9+0.2 and the independent N115 and SNR G54.4-0.3. |
| In the text | |
|
Fig. 2 The example of a mask for a case of the bubble F (=IR bubble N115). |
| In the text | |
|
Fig. 3 Multiwavelength image of the background system (left: the total system, right: the small central region. Positions of bubbles A (upper right), B (lower left), and C (small in the middle) are overlaid. The HI is summed over the velocity interval: 38.9 km s-1<vLSR< 42.2 km s-1 (left) and 39.8 km s-1<vLSR< 42.2 km s-1 (right), the CO over the interval: 38.6 km s-1<vLSR< 41.6 km s-1 (left) and 38.4 km s-1<vLSR< 41.8 km s-1 (right). Crosses in the CO pictures belong to the BGPS clumps found at the corresponding velocity intervals. |
| In the text | |
|
Fig. 4 CO (a solid blue line, the left y-axis) and HI (a dashed red line, the right y-axis) spectrum of bubble C (the background system). The HI spectrum is taken at the position (54.087°, −0.068°), the CO spectrum at the position (54.123°, −0.103°). |
| In the text | |
|
Fig. 5 Multiwavelength image of the foreground system (left: the total system, right: the small central region). Positions of bubbles D (upper left), E (lower right) and F (small in the middle) are overlaid. The HI is summed over the velocity interval: 23.3 km s-1<vLSR< 24.9 km s-1 (left) and 23.3 km s-1<vLSR< 24.1 km s-1 (right), the CO over the interval: 23.8 km s-1<vLSR< 25.0 km s-1 and 23.9 km s-1<vLSR< 24.8 km s-1 . Crosses in the CO pictures belong to the BGPS clumps found at the corresponding velocity intervals. |
| In the text | |
|
Fig. 6 CO (solid blue line, the left y-axis) and HI (dashed red line, the right y-axis) spectrum of bubble F (the foreground system). The HI spectrum is taken at the position (53.573°, −0.059°), the CO spectrum at the position (53.558°, 0.003°). The HI spectrum of bubble D (dotted green line) is overlaid, its position is (53.56°, −0.014°). |
| In the text | |
|
Fig. 7 Latitude-velocity diagram of bubble F (the foreground system) at l = 53.56°. The red colour corresponds to the HI emission, the green colour to CO. |
| In the text | |
|
Fig. 8 Schematic picture of the two systems, background (smaller red one) and foreground (larger blue one) with young clusters and pulsars in the area. |
| In the text | |
|
Fig. 9 Cartoon of the region with all previously known and newly identified bubbles. There are two systems: a foreground system (larger bubbles D and E and a small bubble F connected to the IR bubble N115); and the background system (bubbles A = a radio loop GS053.9+0.2, B = SNR G054.4-0.3 and small C = N116+117). |
| In the text | |
Current usage metrics show cumulative count of Article Views (full-text article views including HTML views, PDF and ePub downloads, according to the available data) and Abstracts Views on Vision4Press platform.
Data correspond to usage on the plateform after 2015. The current usage metrics is available 48-96 hours after online publication and is updated daily on week days.
Initial download of the metrics may take a while.