Free Access
Fig. 8
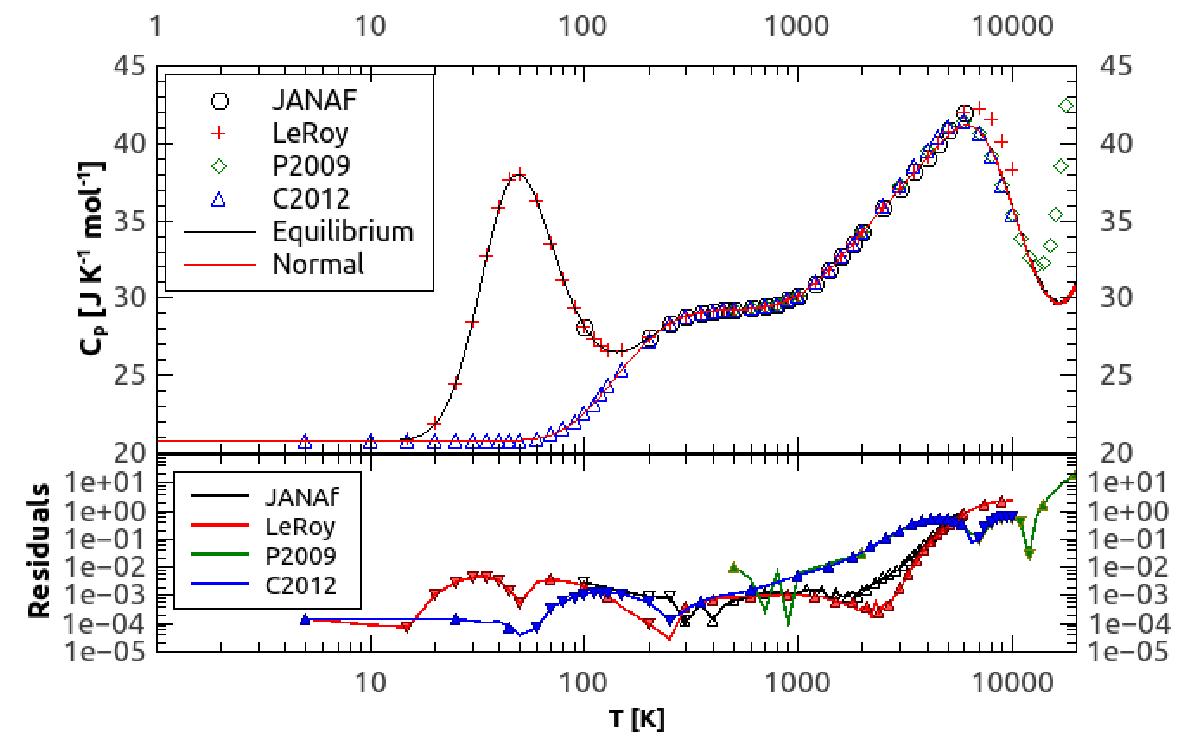
Calculated Cp comparison to other studies. The top panel shows resulting Cp values, the bottom panel residuals (other – ours) on a logarithmic scale. Facing down triangles indicate that other results have lower values than ours, facing up triangles indicate that the values are higher.
Current usage metrics show cumulative count of Article Views (full-text article views including HTML views, PDF and ePub downloads, according to the available data) and Abstracts Views on Vision4Press platform.
Data correspond to usage on the plateform after 2015. The current usage metrics is available 48-96 hours after online publication and is updated daily on week days.
Initial download of the metrics may take a while.