Fig. 4
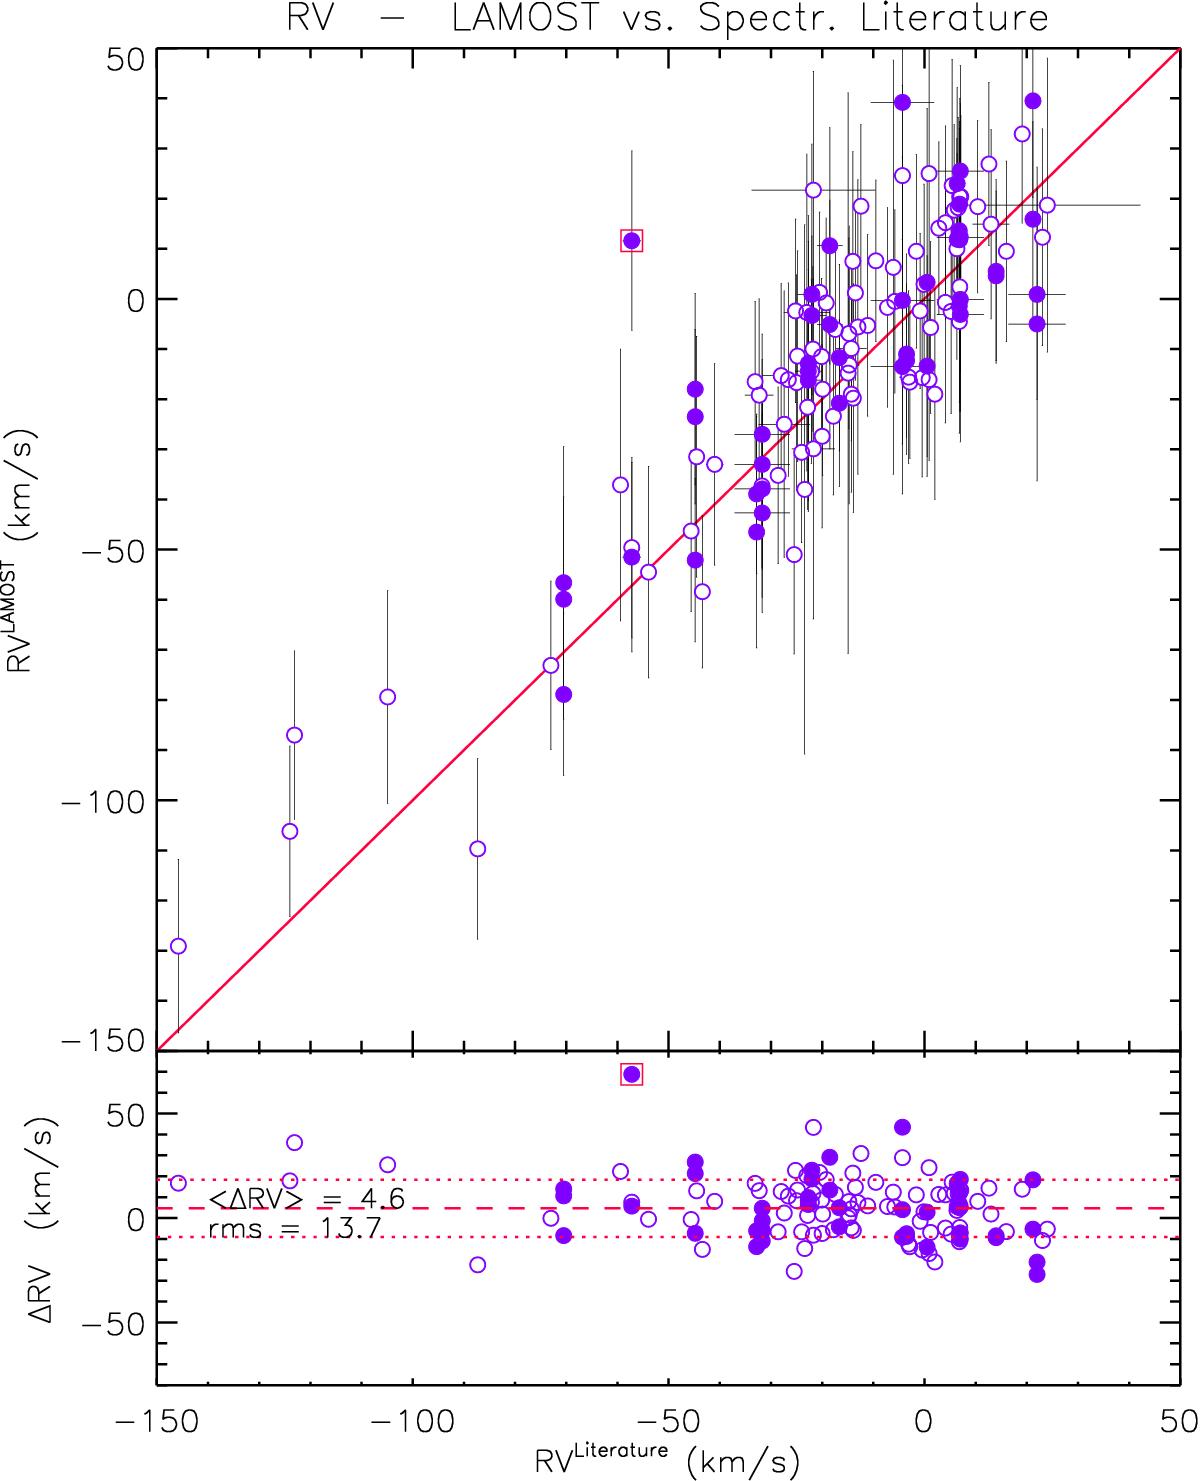
Top panel: comparison between the RV measured on LAMOST spectra (Table A.1) with literature values based mainly on high-resolution spectra (open circles). Filled circles refer to stars with multiple LAMOST observations. The continuous line is the one-to-one relationship. The differences, shown in the bottom panel, show a mean value of ≃+5 km s-1 (dashed line) and a standard deviation of about 14 km s-1 (dotted lines). Discrepant values are indicated with filled circles enclosed in squares in both panels.
Current usage metrics show cumulative count of Article Views (full-text article views including HTML views, PDF and ePub downloads, according to the available data) and Abstracts Views on Vision4Press platform.
Data correspond to usage on the plateform after 2015. The current usage metrics is available 48-96 hours after online publication and is updated daily on week days.
Initial download of the metrics may take a while.