Fig. B.2
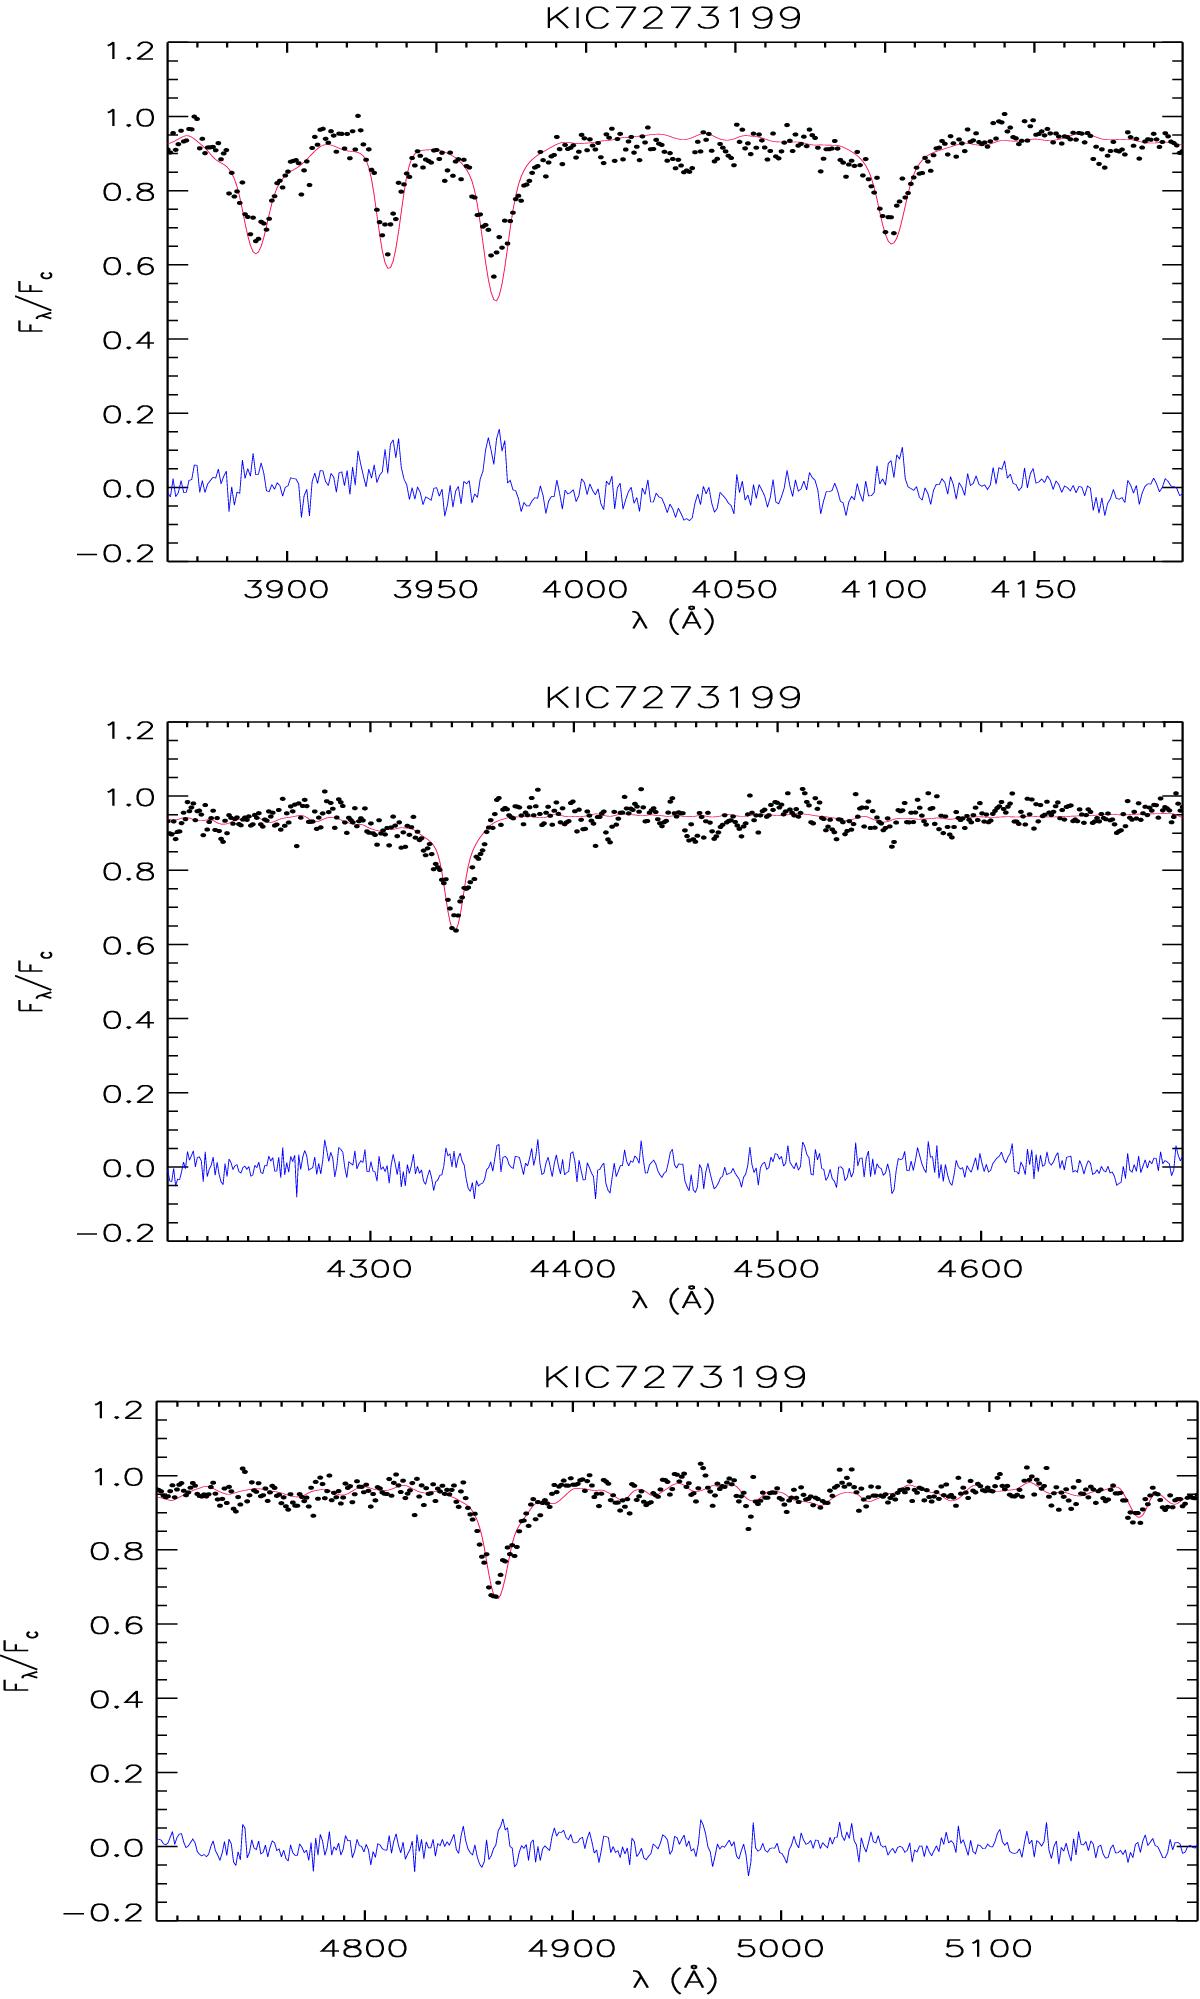
Example of the continuum-normalized LAMOST spectrum of KIC 7273199 in three spectral regions (dots). The best template found by ROTFIT for each spectral region is overplotted with a thin red line. The difference between the two spectra is shown in the bottom of each panel with a blue full line. The spectrum is clearly reminiscent of a warm (F-type) star. However, the asymmetry in the red wings of the Balmer Hγ and Hβ lines, can be due to a spectroscopic companion.
Current usage metrics show cumulative count of Article Views (full-text article views including HTML views, PDF and ePub downloads, according to the available data) and Abstracts Views on Vision4Press platform.
Data correspond to usage on the plateform after 2015. The current usage metrics is available 48-96 hours after online publication and is updated daily on week days.
Initial download of the metrics may take a while.