Free Access
Fig. 2
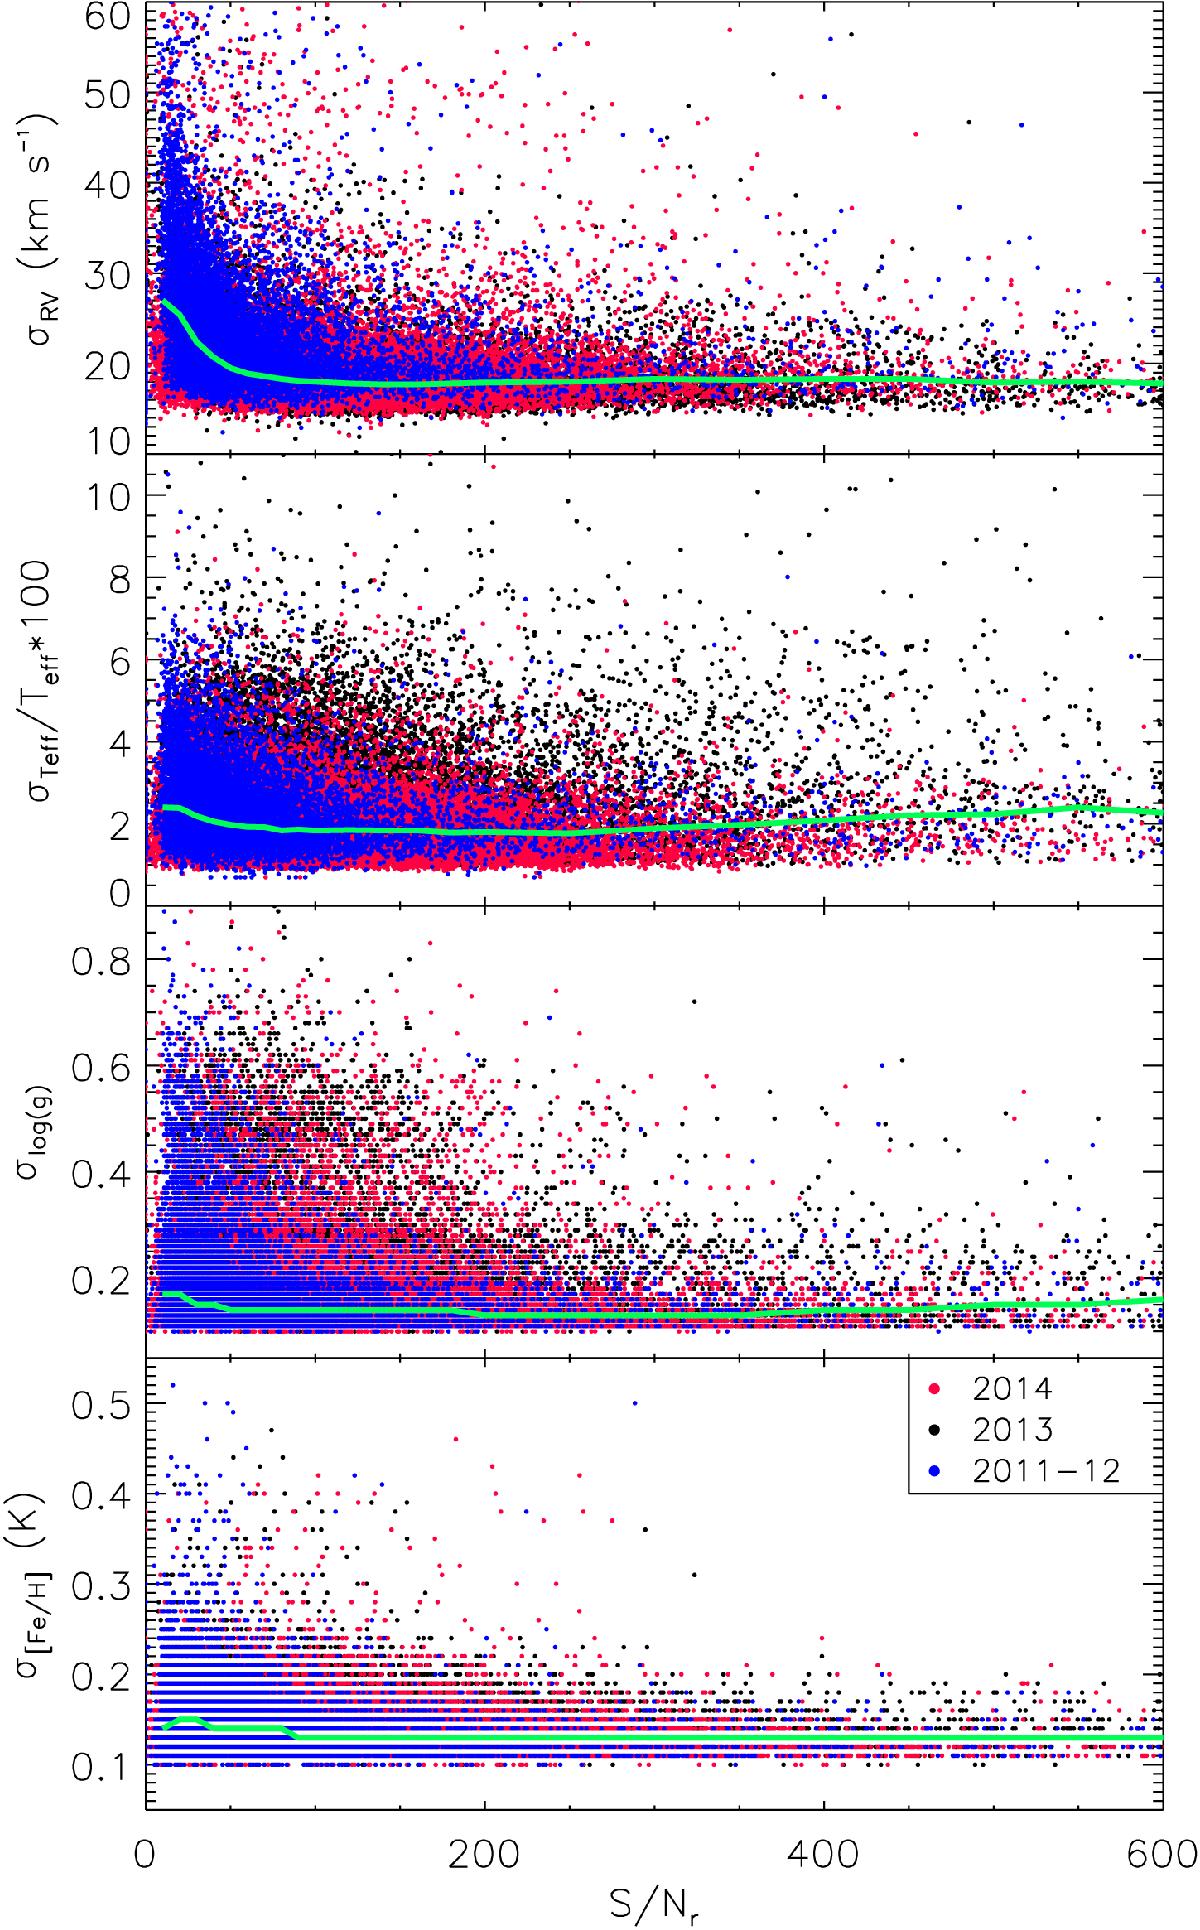
Scatter plots with the errors of RV, Teff, log g, and [Fe/H] (from top to bottom) as a function of the S/N in the r band. The following color coding is used: blue for 2011–2012, black for 2013, and red for 2014. The full green line, in each box, is the median value as a function of S/N.
Current usage metrics show cumulative count of Article Views (full-text article views including HTML views, PDF and ePub downloads, according to the available data) and Abstracts Views on Vision4Press platform.
Data correspond to usage on the plateform after 2015. The current usage metrics is available 48-96 hours after online publication and is updated daily on week days.
Initial download of the metrics may take a while.