Free Access
Fig. 15
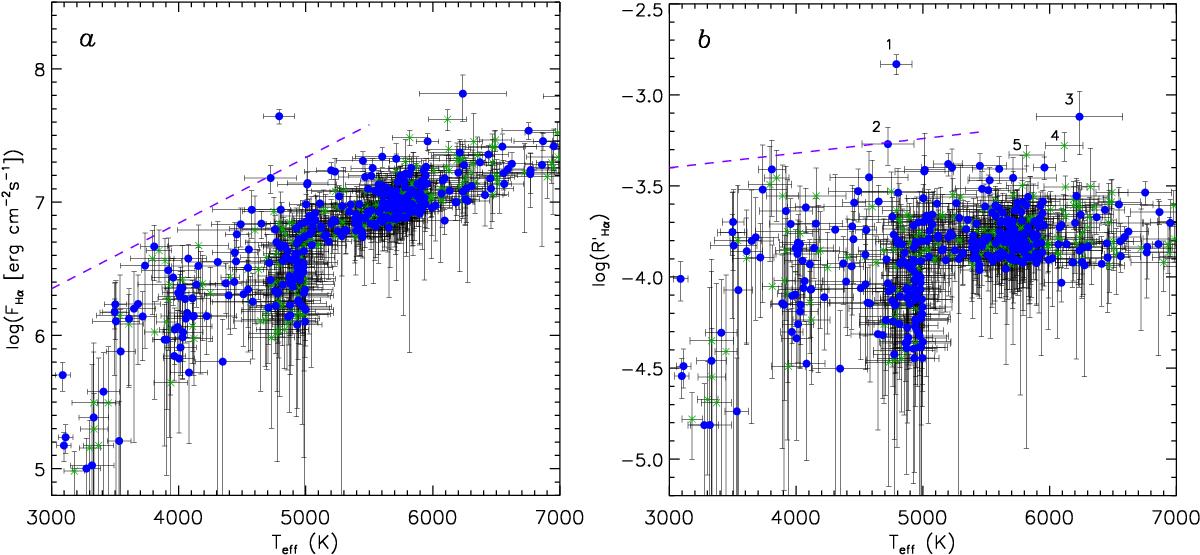
Left panel: Hα flux vs. Teff. Right panel: ![]() vs. Teff. In both panels the candidates with a questionable emission are denoted with green asterisks. The dashed straight line is the boundary between chromospheric emission (below it) and accretion as derived by Frasca et al. (2015).
vs. Teff. In both panels the candidates with a questionable emission are denoted with green asterisks. The dashed straight line is the boundary between chromospheric emission (below it) and accretion as derived by Frasca et al. (2015).
This figure is made of several images, please see below:
Current usage metrics show cumulative count of Article Views (full-text article views including HTML views, PDF and ePub downloads, according to the available data) and Abstracts Views on Vision4Press platform.
Data correspond to usage on the plateform after 2015. The current usage metrics is available 48-96 hours after online publication and is updated daily on week days.
Initial download of the metrics may take a while.