Fig. 12
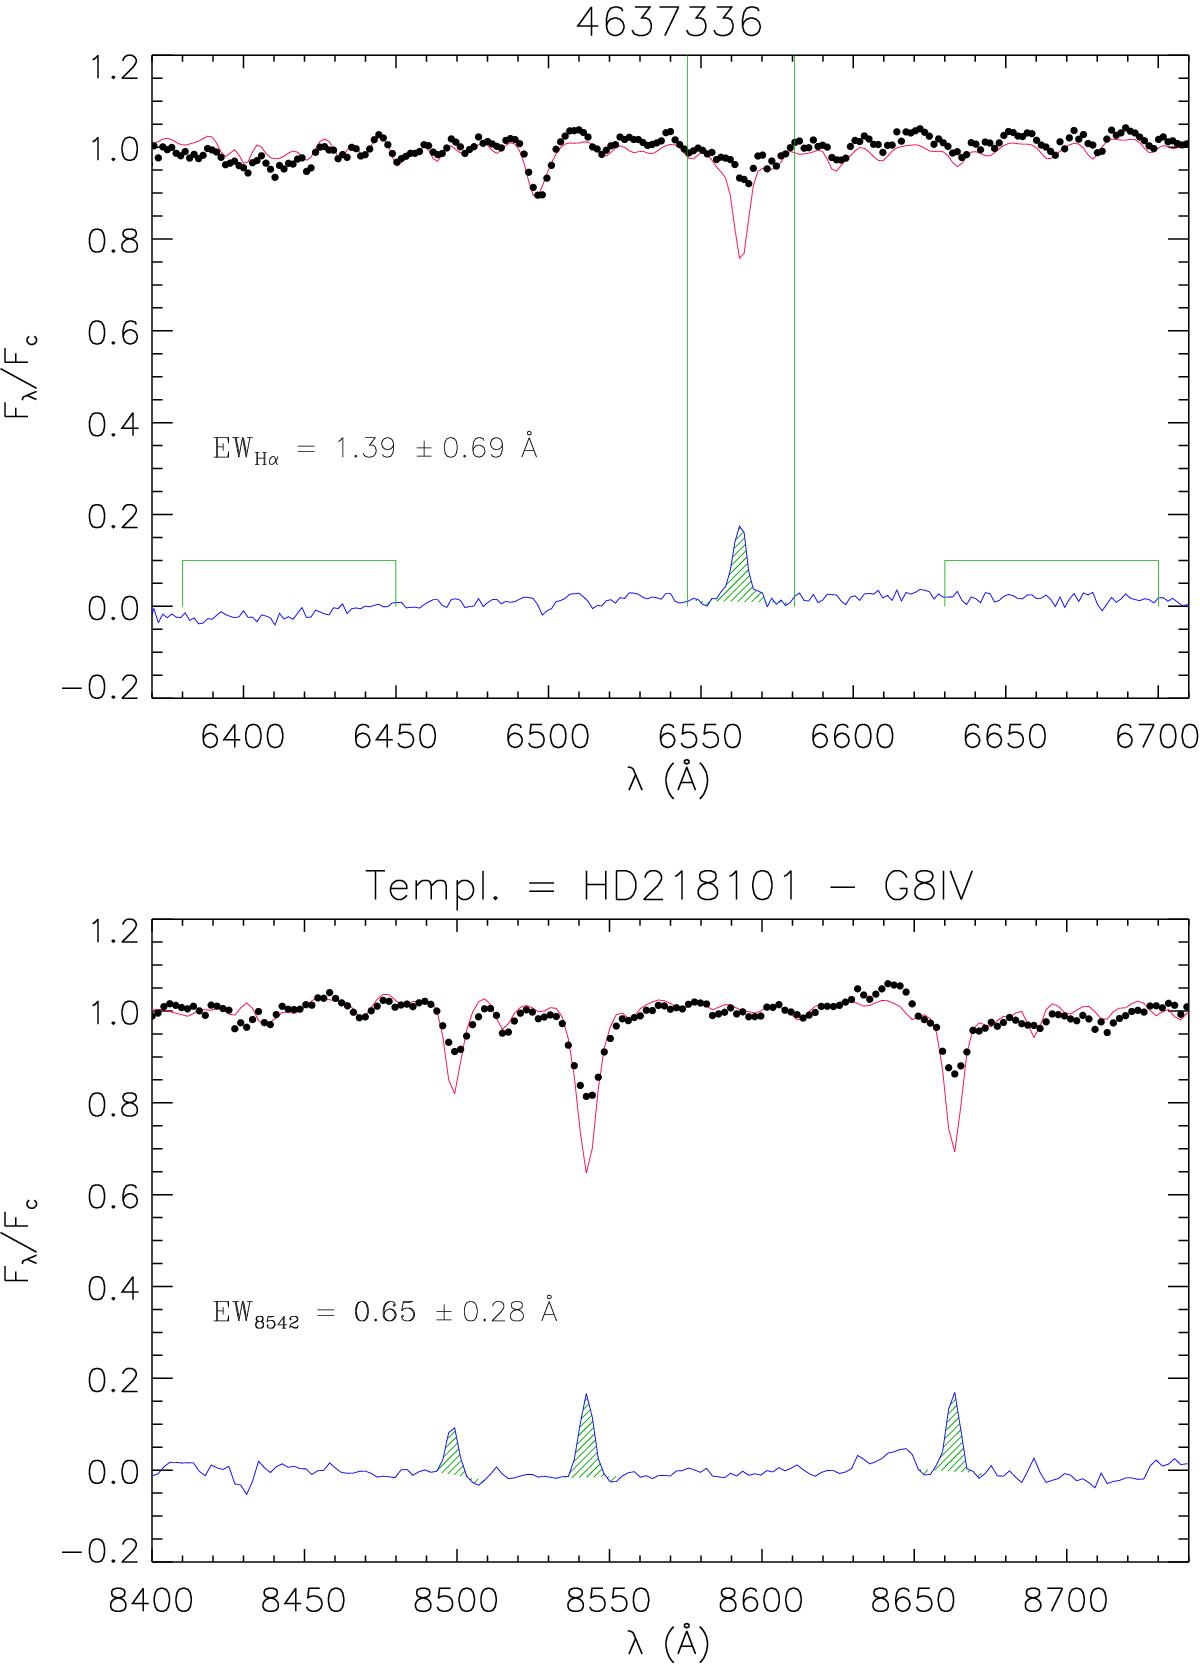
Upper panel: LAMOST spectrum of KIC 4637336 (black dotted line), a late G-type star with the Hα totally filled in by emission. The inactive template is overplotted with a thin red line. The difference between target and template spectrum, plotted in the bottom of the panel (blue line), shows only a residual Hα emission (hatched area). The integration range for the residual equivalent width, ![]() is indicated by the two vertical lines and the two regions used for the evaluation of the continuum setting error are also denoted. Lower panel: the spectral region around the Ca ii infrared triplet (IRT) is shown with the same line styles as for Hα. The residual chromospheric emission in the cores of the Ca ii IRT lines is outlined by the hatched areas.
is indicated by the two vertical lines and the two regions used for the evaluation of the continuum setting error are also denoted. Lower panel: the spectral region around the Ca ii infrared triplet (IRT) is shown with the same line styles as for Hα. The residual chromospheric emission in the cores of the Ca ii IRT lines is outlined by the hatched areas.
Current usage metrics show cumulative count of Article Views (full-text article views including HTML views, PDF and ePub downloads, according to the available data) and Abstracts Views on Vision4Press platform.
Data correspond to usage on the plateform after 2015. The current usage metrics is available 48-96 hours after online publication and is updated daily on week days.
Initial download of the metrics may take a while.