Free Access
Fig. 1
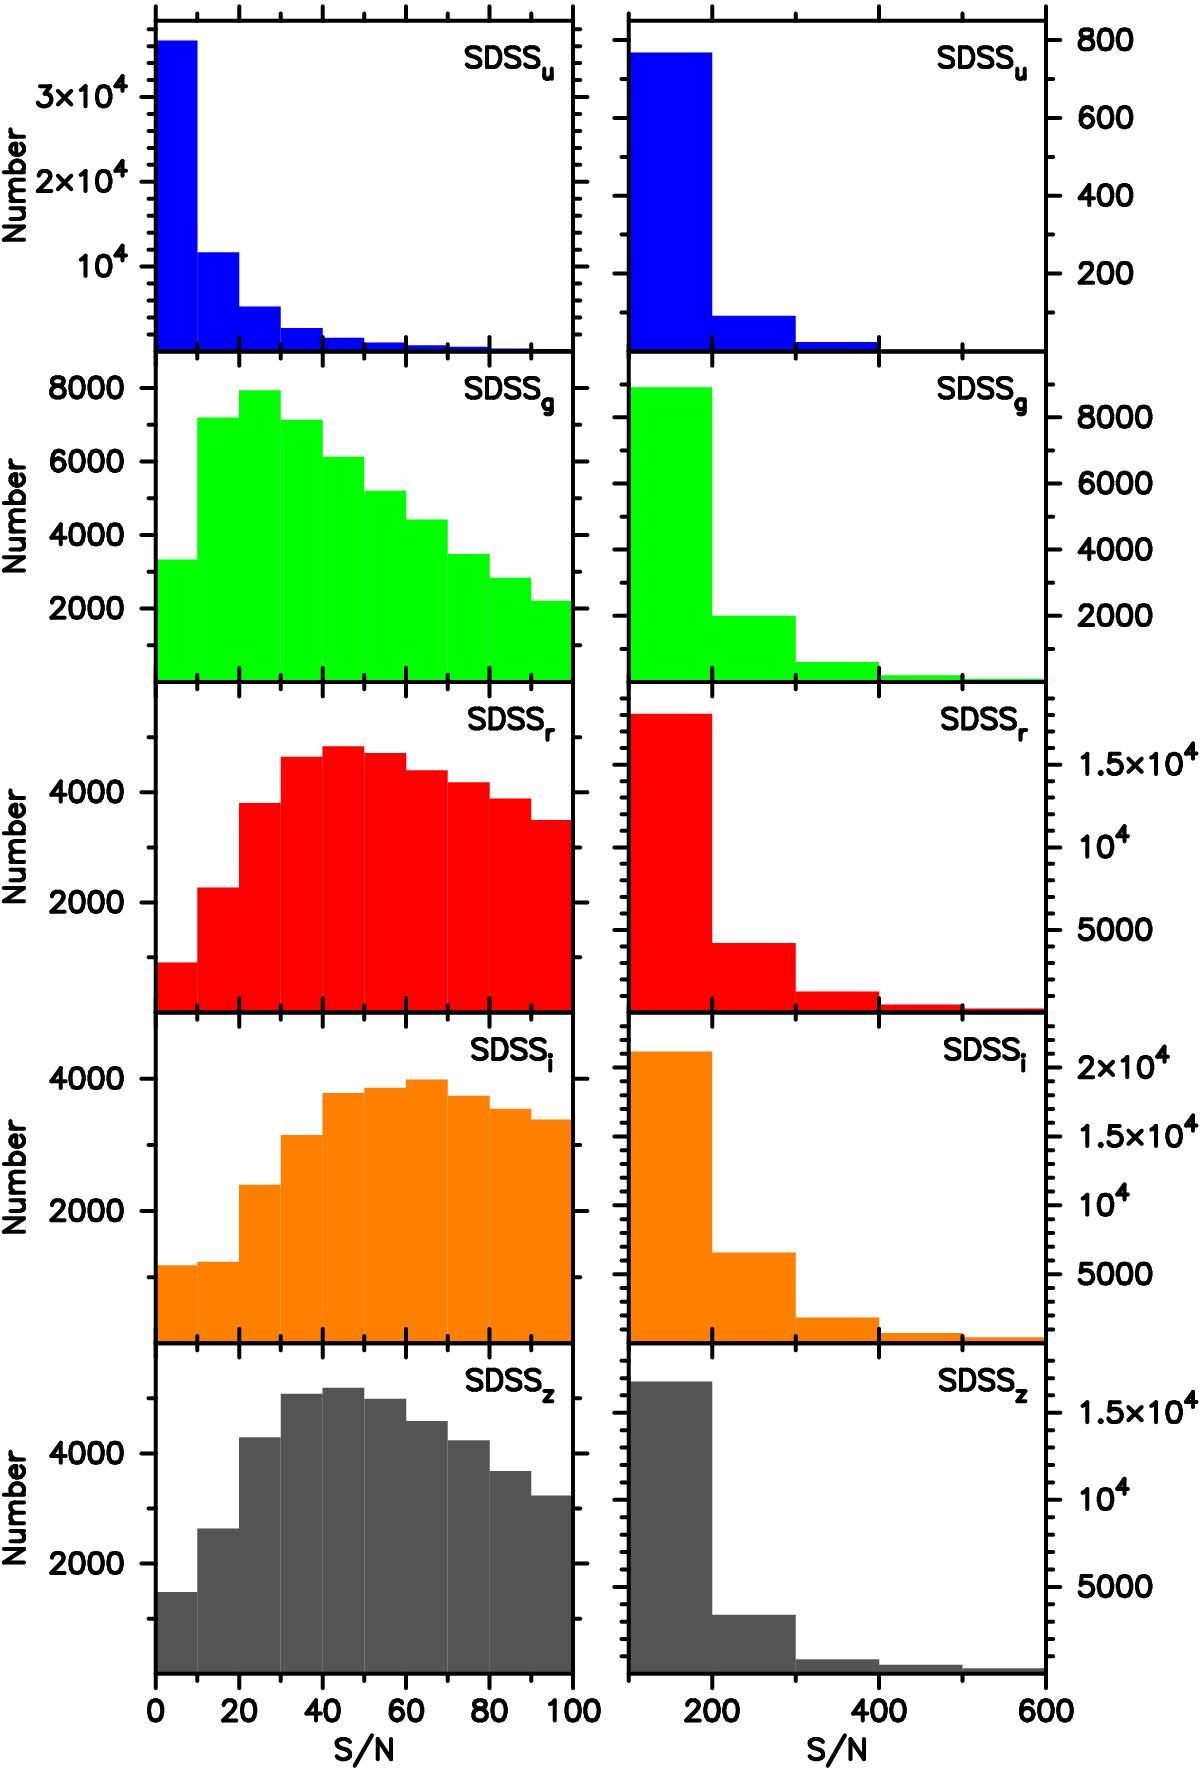
Histograms of the S/N of the spectra from which we derived the atmospheric parameters with the ROTFIT code measured at the effective wavelengths of the Sloan DSS filters ugriz. The left and right panels show the S/N range [0, 100] with bin size 10 and the S/N range [100, 600] with bin size 100, respectively.
Current usage metrics show cumulative count of Article Views (full-text article views including HTML views, PDF and ePub downloads, according to the available data) and Abstracts Views on Vision4Press platform.
Data correspond to usage on the plateform after 2015. The current usage metrics is available 48-96 hours after online publication and is updated daily on week days.
Initial download of the metrics may take a while.