Fig. 7
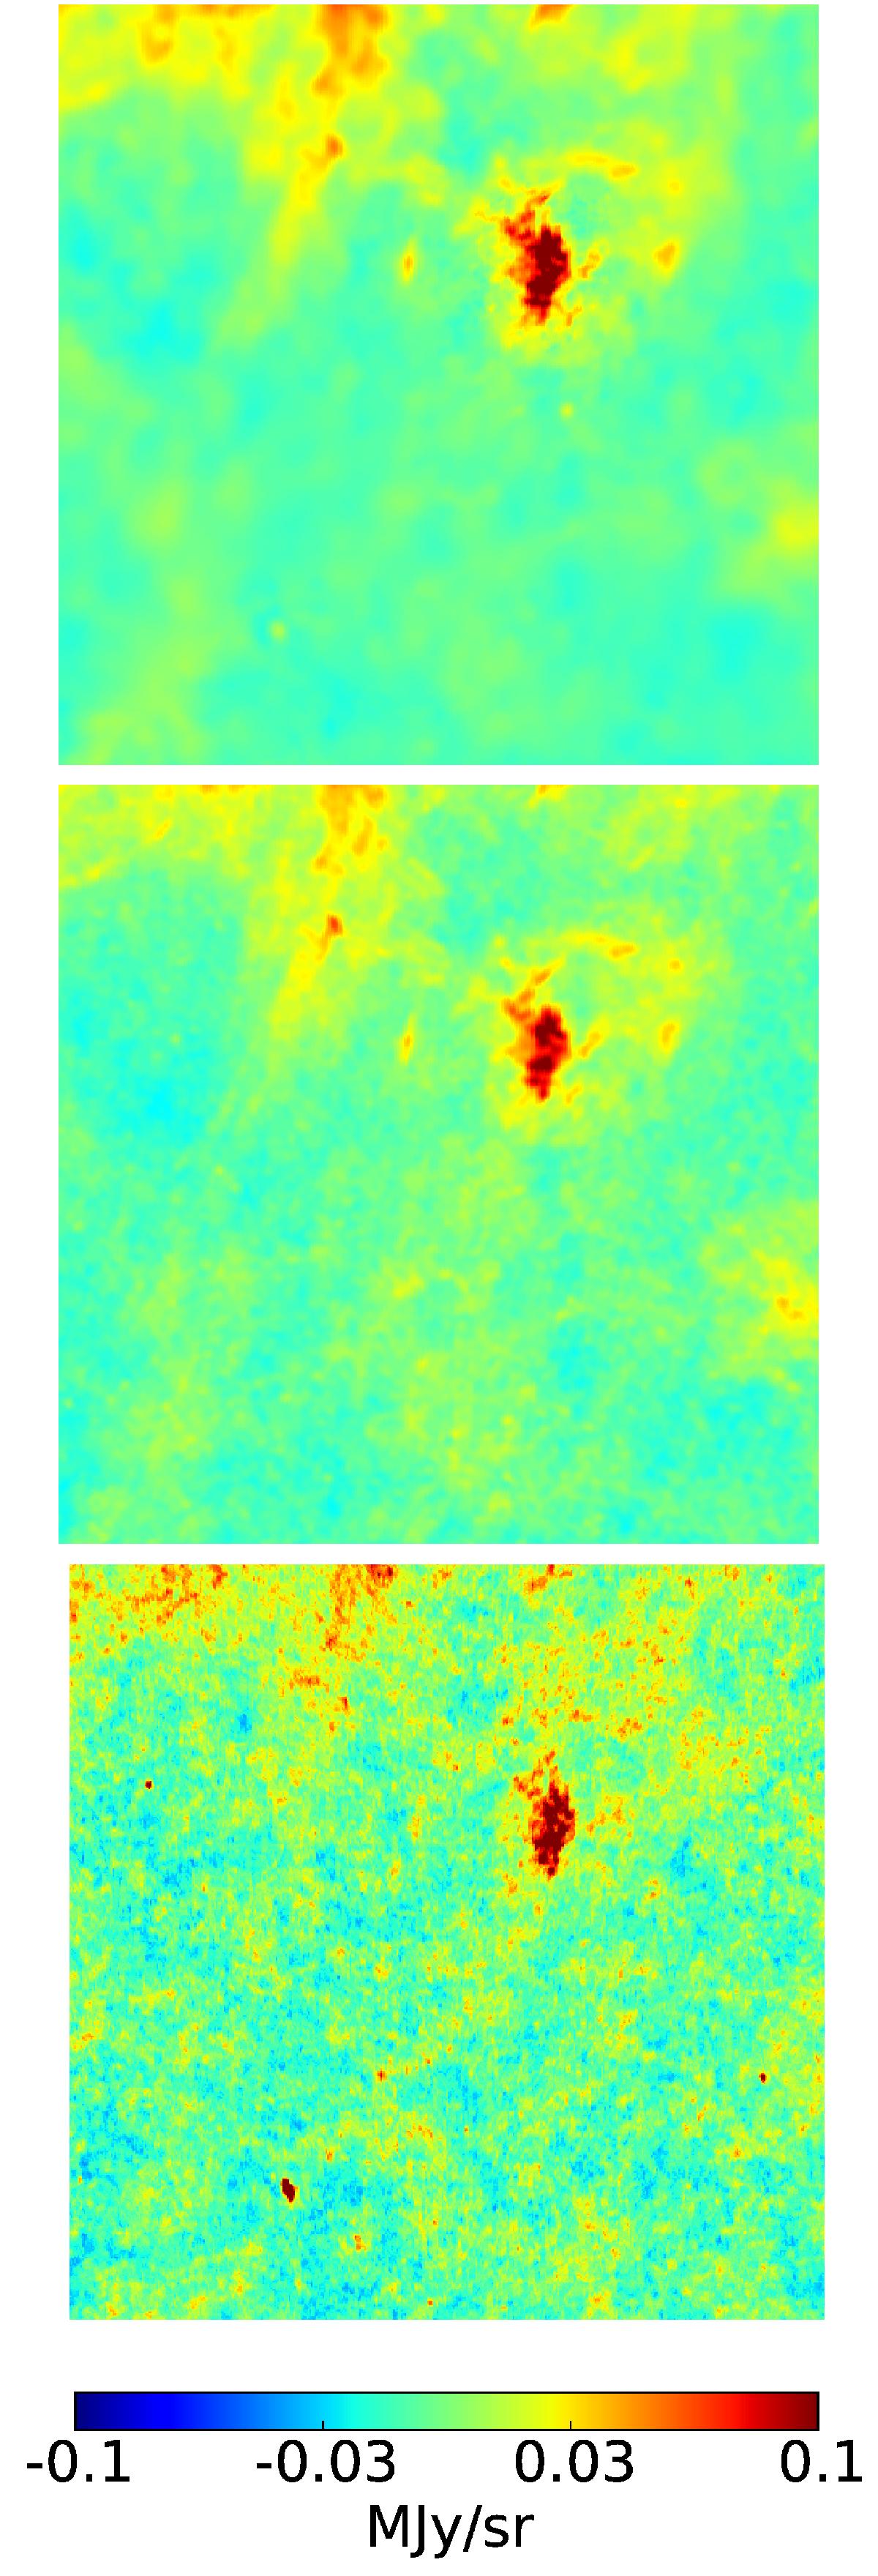
![]() gnomonic projection of dust intensity templates centred at high latitude (l,b) = (90°, − 80°) at a map resolution of 5′. Top: new PSM dust from multi-dimensional GNILC (Remazeilles et al. 2011). Middle: original PSM dust (Delabrouille et al. 2013) based on the model of Finkbeiner et al. (1999). Bottom: Planck 2013 dust model (Planck Collaboration XI 2014). Comparing the top and bottom panels, the improvement in reducing the contamination of the dust by small-scale CIB anisotropies at high Galactic latitude is clearly visible.
gnomonic projection of dust intensity templates centred at high latitude (l,b) = (90°, − 80°) at a map resolution of 5′. Top: new PSM dust from multi-dimensional GNILC (Remazeilles et al. 2011). Middle: original PSM dust (Delabrouille et al. 2013) based on the model of Finkbeiner et al. (1999). Bottom: Planck 2013 dust model (Planck Collaboration XI 2014). Comparing the top and bottom panels, the improvement in reducing the contamination of the dust by small-scale CIB anisotropies at high Galactic latitude is clearly visible.
Current usage metrics show cumulative count of Article Views (full-text article views including HTML views, PDF and ePub downloads, according to the available data) and Abstracts Views on Vision4Press platform.
Data correspond to usage on the plateform after 2015. The current usage metrics is available 48-96 hours after online publication and is updated daily on week days.
Initial download of the metrics may take a while.