Free Access
Fig. 5
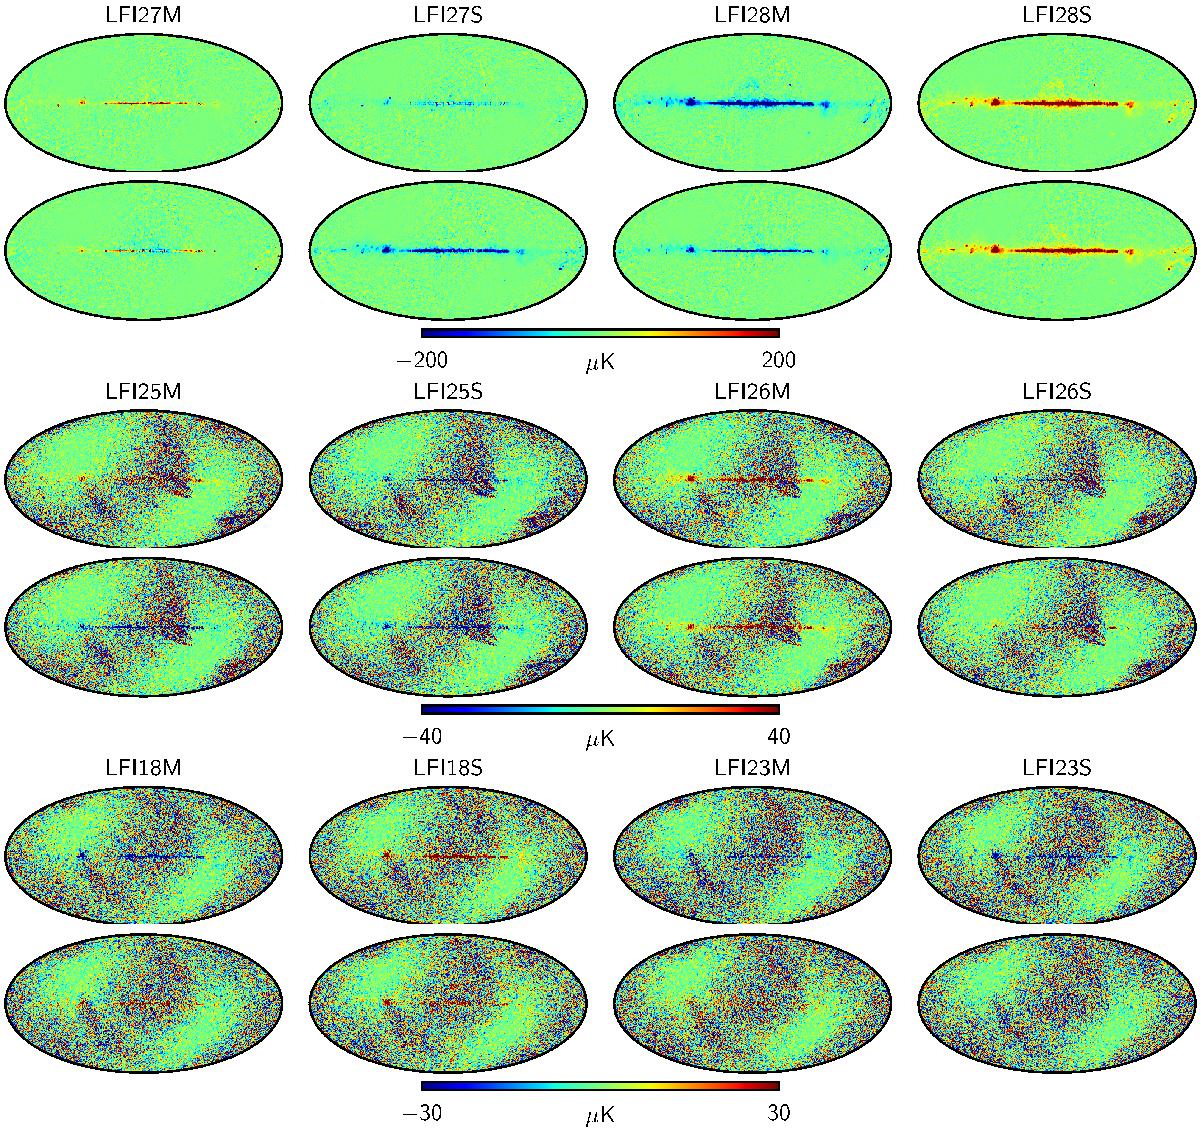
Pairs of measured bandpass mismatch LFI maps, comparing FFP8 simulations (upper) and 2015 Planck (lower) data. Our method of estimating the total bandpass mismatch between each detector and a frequency average is detailed in Appendix A.
This figure is made of several images, please see below:
Current usage metrics show cumulative count of Article Views (full-text article views including HTML views, PDF and ePub downloads, according to the available data) and Abstracts Views on Vision4Press platform.
Data correspond to usage on the plateform after 2015. The current usage metrics is available 48-96 hours after online publication and is updated daily on week days.
Initial download of the metrics may take a while.