Fig. 4
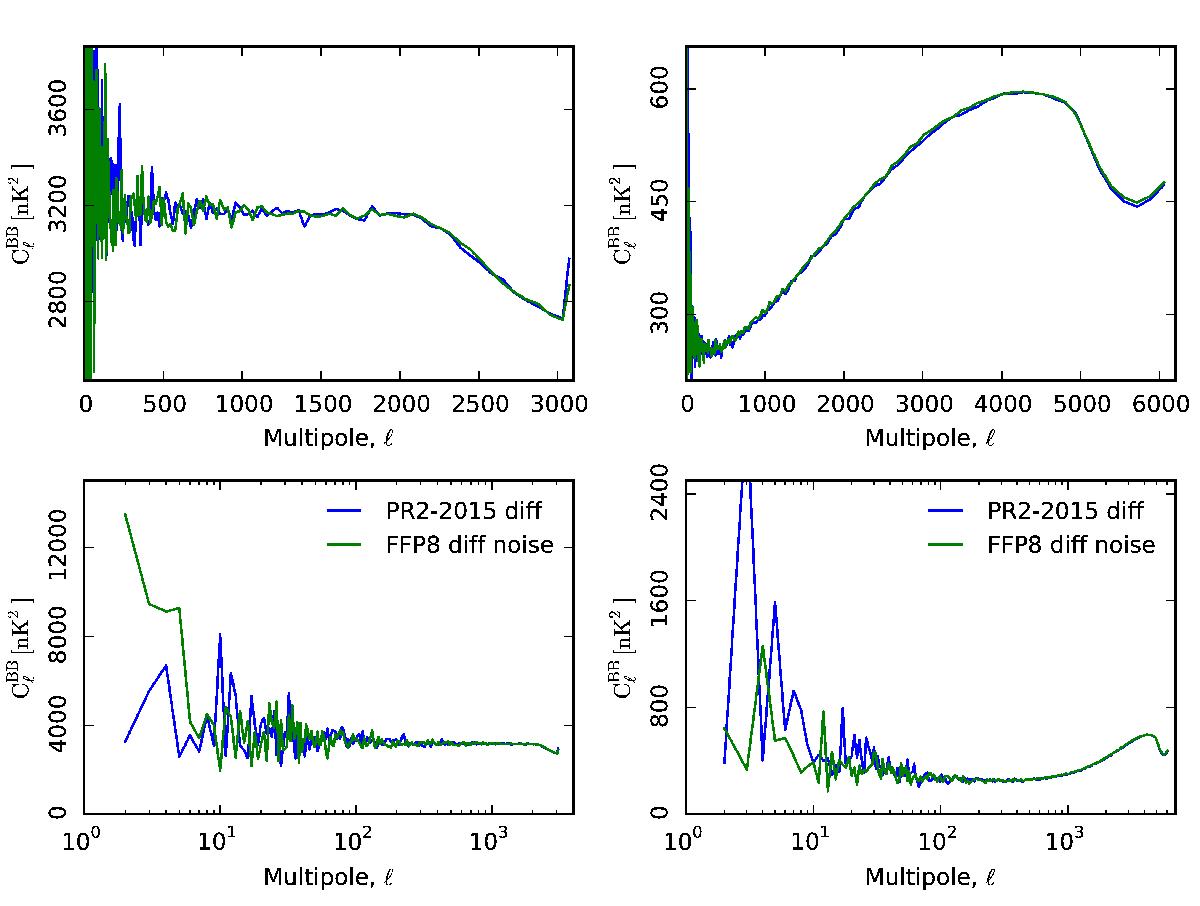
BB spectra of 70 GHz (left) and 100 GHz (right) half-ring half difference noise maps, for both FFP8 simulations (green) and flight data (black). Differences at the low-ℓ end are caused by sample variance. These are pseudo-spectra, computed on 75% of the sky with the Galactic plane and point sources masked. Top: linear horizontal axis to show small-scale behaviour. Bottom: logarithmic horizontal axis to show large-scale behaviour.
Current usage metrics show cumulative count of Article Views (full-text article views including HTML views, PDF and ePub downloads, according to the available data) and Abstracts Views on Vision4Press platform.
Data correspond to usage on the plateform after 2015. The current usage metrics is available 48-96 hours after online publication and is updated daily on week days.
Initial download of the metrics may take a while.