Fig. 3
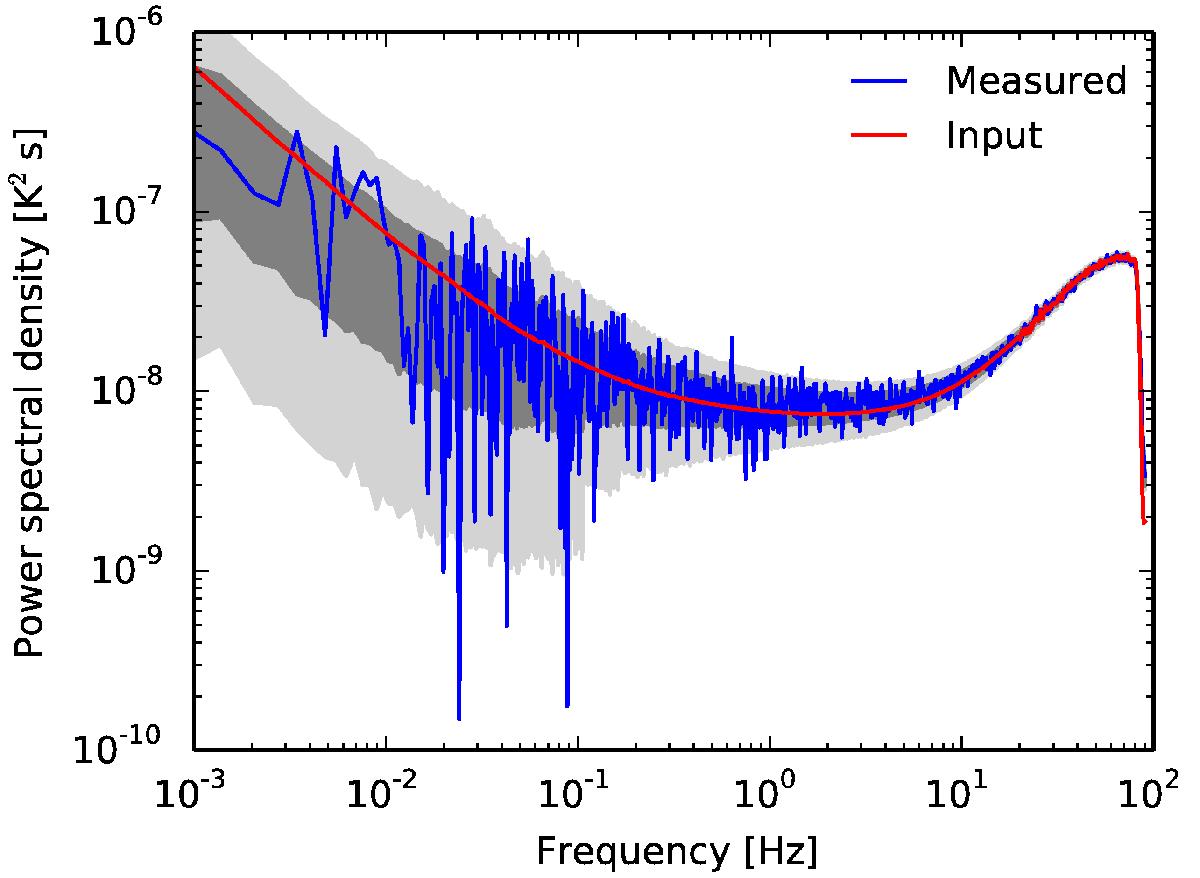
Example comparison of the input and recovered noise PSDs for one pointing period of a signal+noise simulation of HFI bolometer 100-1a. The shaded regions around the input model reflect the asymmetric realization scatter of the estimated PSDs at 68% and 95% confidence intervals in each of the 707 logarithmically-placed frequency bins.
Current usage metrics show cumulative count of Article Views (full-text article views including HTML views, PDF and ePub downloads, according to the available data) and Abstracts Views on Vision4Press platform.
Data correspond to usage on the plateform after 2015. The current usage metrics is available 48-96 hours after online publication and is updated daily on week days.
Initial download of the metrics may take a while.