Fig. 18
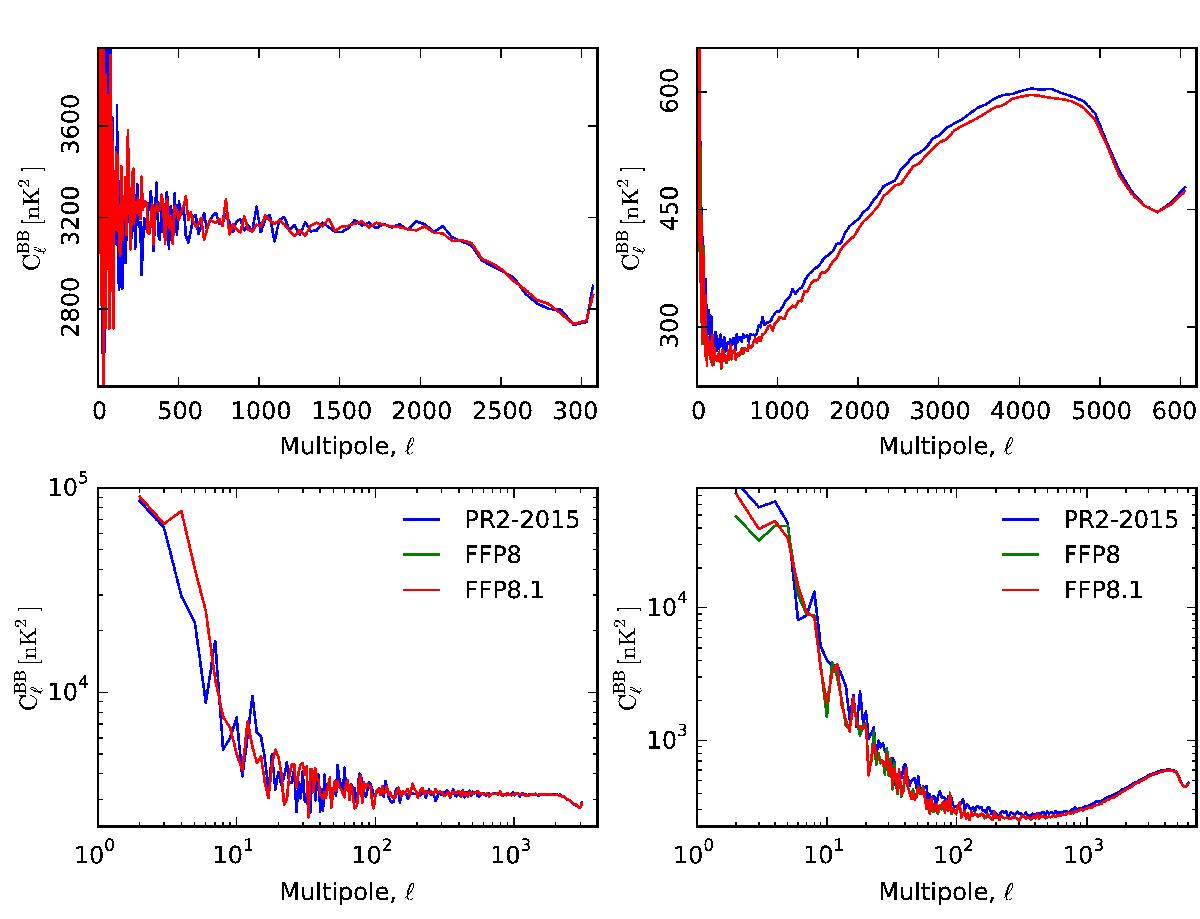
Comparison of the BB spectra of the channel/mission/full simulated and flight data maps using pseudo-spectra computed on 75% of the sky with the Galaxy and point sources masked, showing excellent agreement at 70 GHz but a few percent discrepancy at almost all angular scales at 100 GHz. Left: 70 GHz full map BB-spectra. Right: 100 GHz full map BB-spectra. Top: linear horizontal axis shows small scale behaviour. Bottom: logarithmic horizontal axis shows large scale behaviour.
Current usage metrics show cumulative count of Article Views (full-text article views including HTML views, PDF and ePub downloads, according to the available data) and Abstracts Views on Vision4Press platform.
Data correspond to usage on the plateform after 2015. The current usage metrics is available 48-96 hours after online publication and is updated daily on week days.
Initial download of the metrics may take a while.