Free Access
Fig. 1
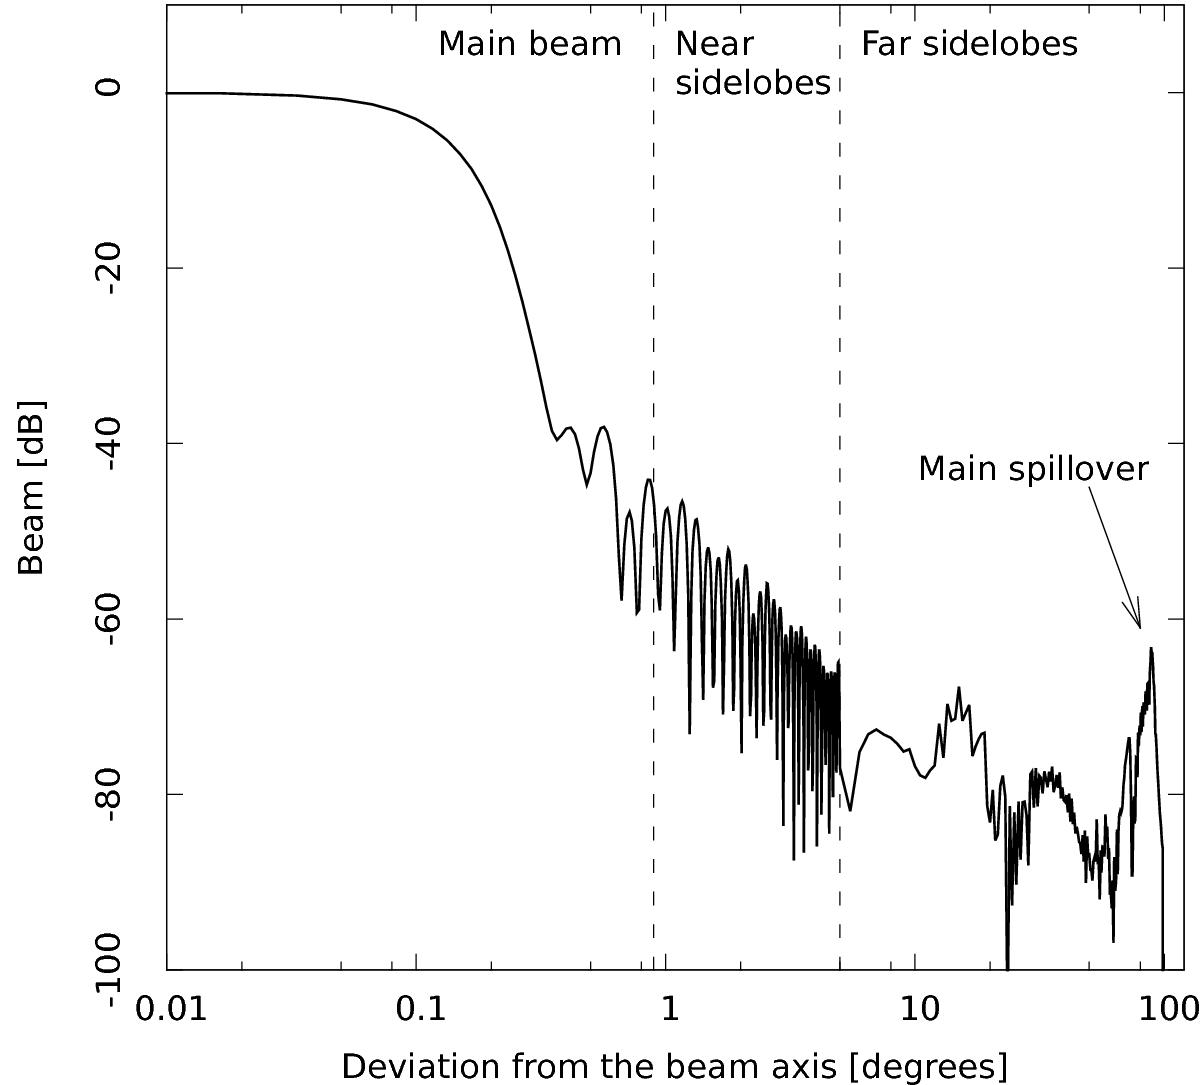
Example of a cut of the simulated beam pattern of the 70GHz LFI18-S radiometer. The cut passes through the main reflector spillover of the Planck telescope. The plot shows, in particular, the level and shape of the near sidelobes.
Current usage metrics show cumulative count of Article Views (full-text article views including HTML views, PDF and ePub downloads, according to the available data) and Abstracts Views on Vision4Press platform.
Data correspond to usage on the plateform after 2015. The current usage metrics is available 48-96 hours after online publication and is updated daily on week days.
Initial download of the metrics may take a while.