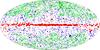
Fig. 2

Top: distribution of the validated sources from the PCCS2. Red, blue, and green circles show sources from the 30, 143, and 857 GHz catalogues, respectively. Bottom: locations of the sources in the 143 and 857 PCCS2E, shown by blue and green circles, respectively. The figure is a full-sky Mollweide projection with the Galactic equator horizontal; longitude increases to the left with the Galactic centre in the centre of the map. The size of the filled circles gives an idea of the relative flux densities of the sources per frequency, where the larger circles correspond to larger flux densities. Note that a different size range for each channel was necessary for visualization purposes.
Current usage metrics show cumulative count of Article Views (full-text article views including HTML views, PDF and ePub downloads, according to the available data) and Abstracts Views on Vision4Press platform.
Data correspond to usage on the plateform after 2015. The current usage metrics is available 48-96 hours after online publication and is updated daily on week days.
Initial download of the metrics may take a while.