Fig. 16

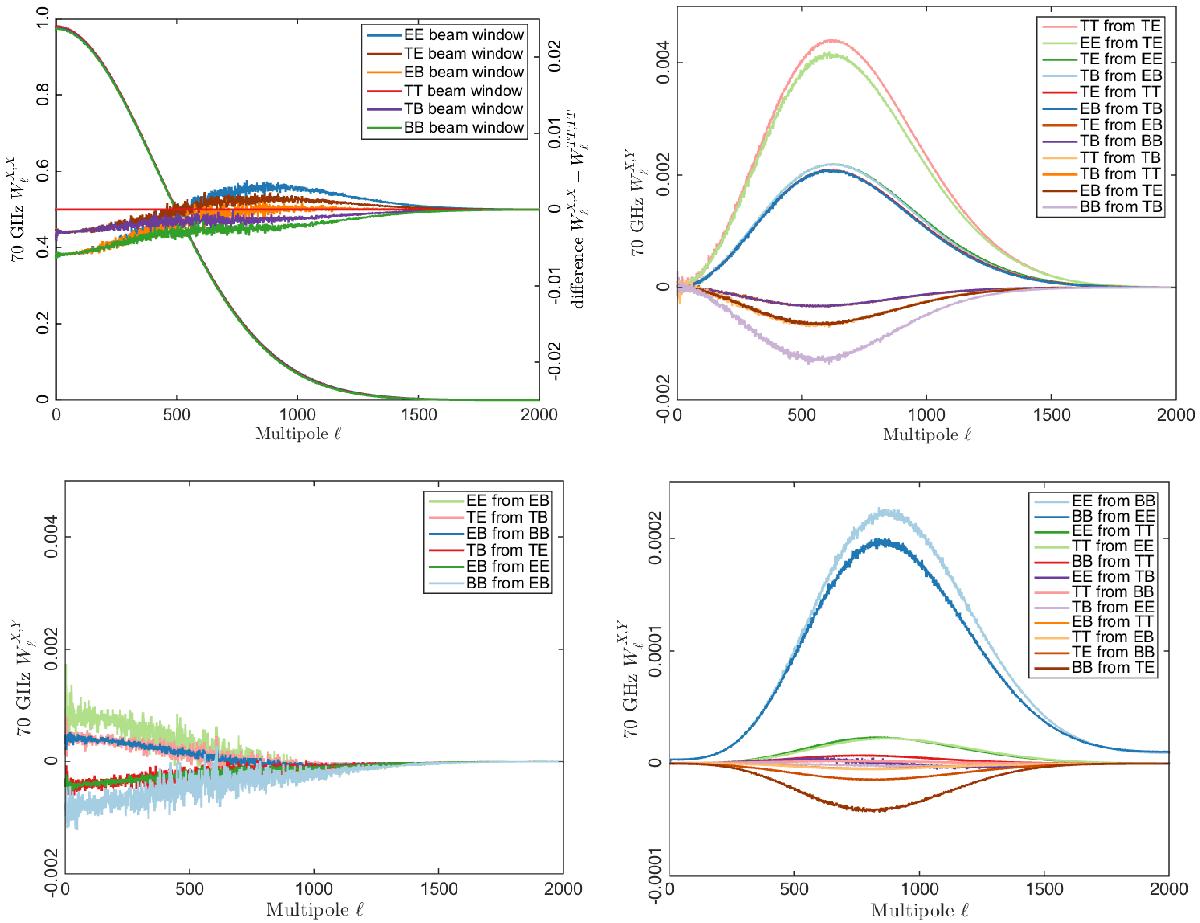
Diagonal (top left panel) and off-diagonal components of the 70 GHz main beam matrix window function. “X from Y” stands for ![]() and “X beam window” for the diagonal components
and “X beam window” for the diagonal components ![]() . To bring out the difference between the six diagonal components, we also show the difference
. To bring out the difference between the six diagonal components, we also show the difference ![]() (the near-horizontal lines in the top left panel, with the scale indicated at the right side of the panel). The 30 off-diagonal components are divided into three panels. The bottom left shows the six components that are largest at low ℓ. The two right panels shows those components that peak at intermediate ℓ. These were further divided according to whether the leakage involves the same components (of T, E, and B) in the “from” and “to” sides (top right) or not (bottom right) – the latter tend to be smaller (we note the difference in scale). There are too many curves for all of them to be clearly visible, so to indicate where each of them lies, the legend lists the components in approximately the same order as they appear in the plot. In the top right panel TE,EE lies under TB,EB; TE,TT under EB,TB; TE,EB under TB,BB; and both TT,TB and TB,TT under EB,TE. In the bottom right panel EE,TT lies under TT,EE and EB,TT under TT,EB.
(the near-horizontal lines in the top left panel, with the scale indicated at the right side of the panel). The 30 off-diagonal components are divided into three panels. The bottom left shows the six components that are largest at low ℓ. The two right panels shows those components that peak at intermediate ℓ. These were further divided according to whether the leakage involves the same components (of T, E, and B) in the “from” and “to” sides (top right) or not (bottom right) – the latter tend to be smaller (we note the difference in scale). There are too many curves for all of them to be clearly visible, so to indicate where each of them lies, the legend lists the components in approximately the same order as they appear in the plot. In the top right panel TE,EE lies under TB,EB; TE,TT under EB,TB; TE,EB under TB,BB; and both TT,TB and TB,TT under EB,TE. In the bottom right panel EE,TT lies under TT,EE and EB,TT under TT,EB.
Current usage metrics show cumulative count of Article Views (full-text article views including HTML views, PDF and ePub downloads, according to the available data) and Abstracts Views on Vision4Press platform.
Data correspond to usage on the plateform after 2015. The current usage metrics is available 48-96 hours after online publication and is updated daily on week days.
Initial download of the metrics may take a while.


