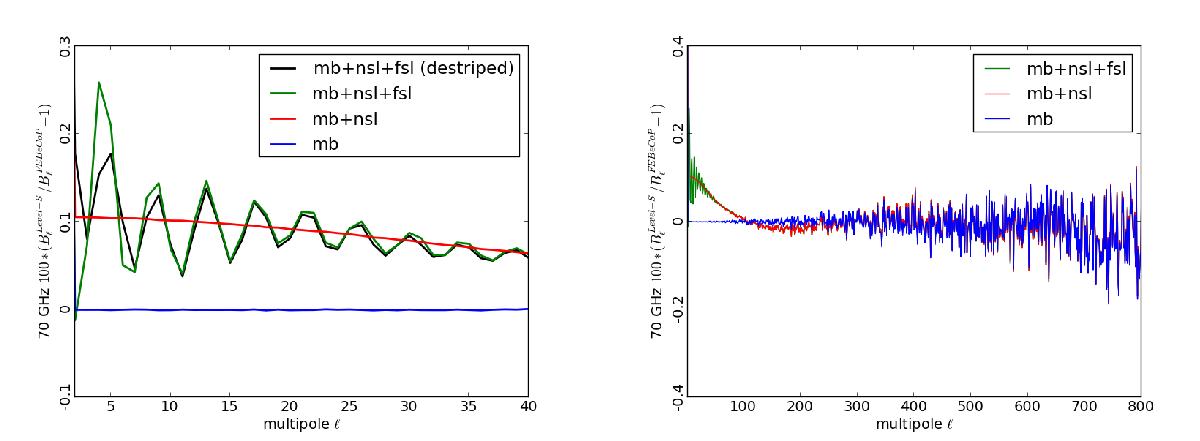
Fig. 15

Per cent difference between the window function obtained using Level-S (see Sect. 5.2) and the FEBeCoP window function (see Sect. 5.1), at 70 GHz. The left panel is an enlargement of the right panel, concentrating on the low multipoles. The contribution from the main beam (mb), near sidelobes (nsl), and far sidelobes (fsl) is shown. The agreement between the Level-S window function computed using the main beams and the FEBeCoP window function is evident, as presented also in Planck Collaboration IV (2014). The effect, 0.1–0.2%, of near and far sidelobes is clearly visible at low ℓ. At high ℓ the difference is mainly simulation variance, due to the small number (49) of CMB realizations.
Current usage metrics show cumulative count of Article Views (full-text article views including HTML views, PDF and ePub downloads, according to the available data) and Abstracts Views on Vision4Press platform.
Data correspond to usage on the plateform after 2015. The current usage metrics is available 48-96 hours after online publication and is updated daily on week days.
Initial download of the metrics may take a while.


