Fig. 9
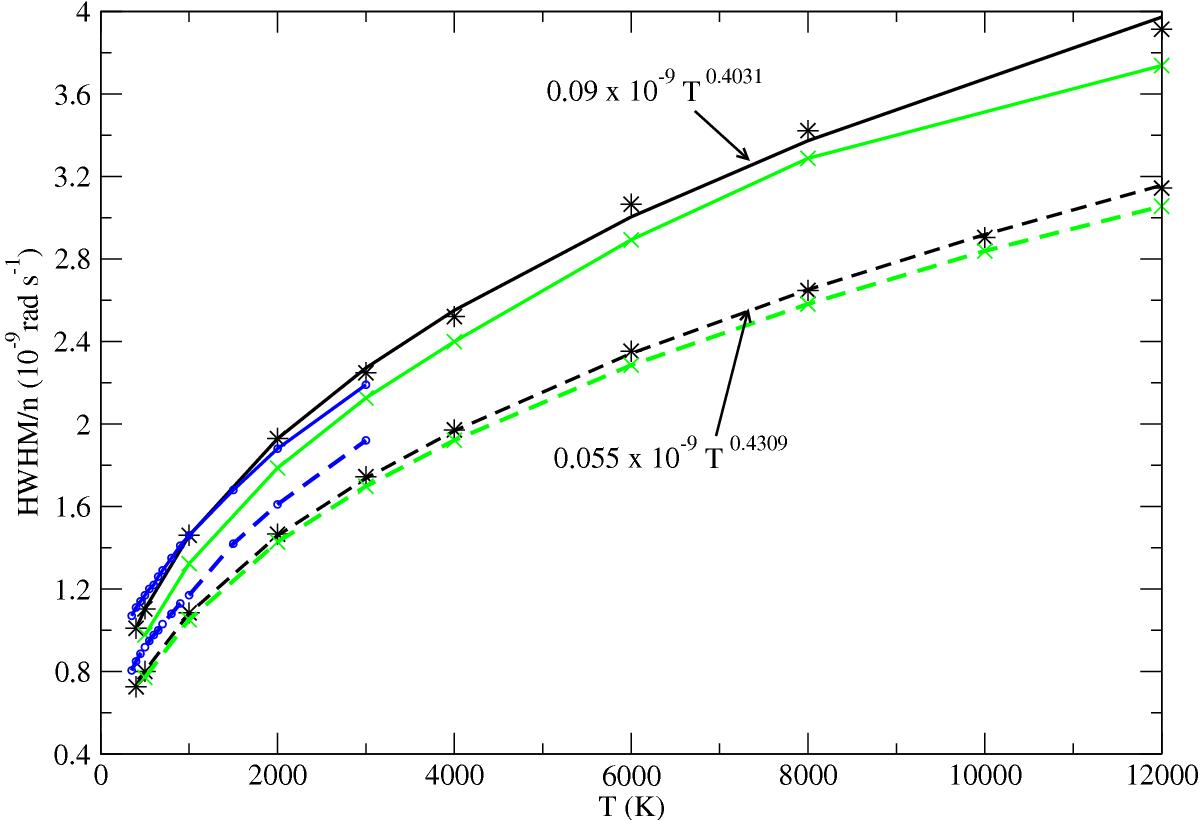
Variation with temperature of the half-width at half-maximum of the 3P3 / 2–3s (full line) and 3P1 / 2–3s (dashed line) resonance lines of Mg+ perturbed by He collisions. GG potentials (black curves), VA potentials (green curves), and model potentials of Monteiro et al. (1986; blue curves). The rates are in units of 10-9 rad s-1.
Current usage metrics show cumulative count of Article Views (full-text article views including HTML views, PDF and ePub downloads, according to the available data) and Abstracts Views on Vision4Press platform.
Data correspond to usage on the plateform after 2015. The current usage metrics is available 48-96 hours after online publication and is updated daily on week days.
Initial download of the metrics may take a while.