Free Access
Fig. 7
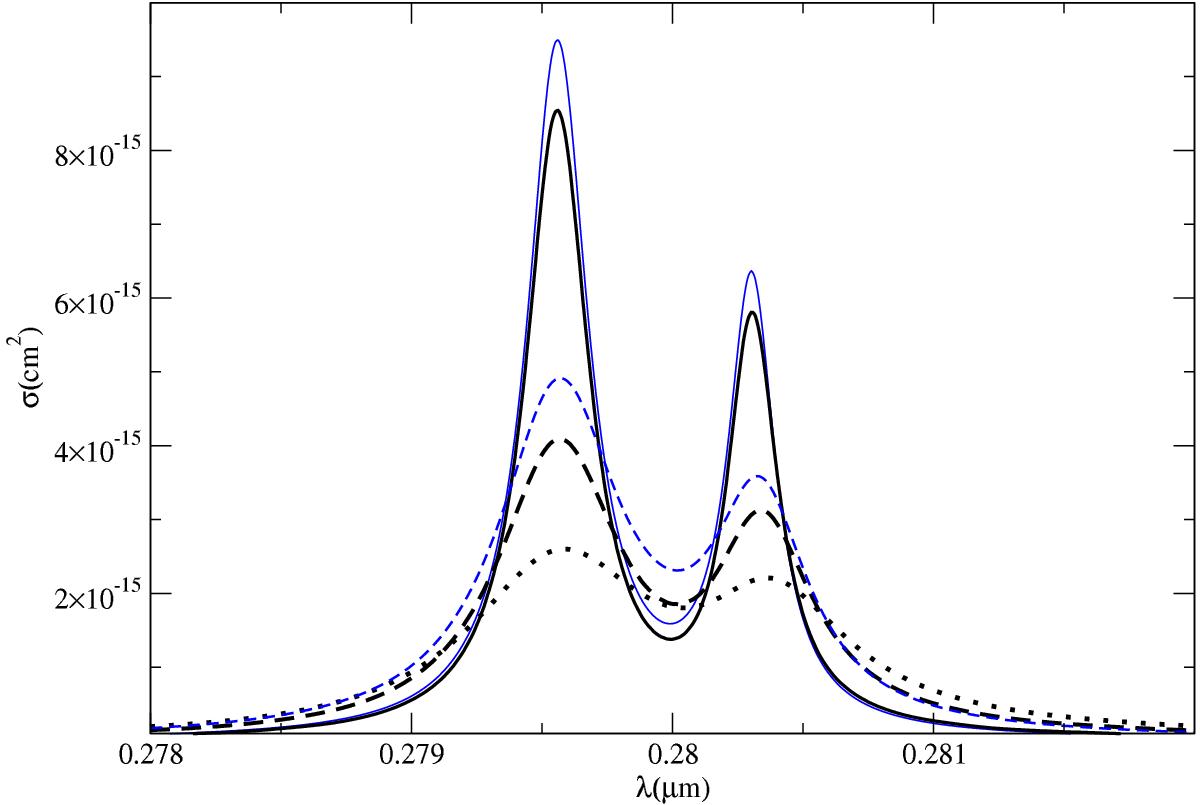
Variation of the absorption cross-section in the central part of the sum of the components P3 / 2 and P1 / 2 with the He density, (from top to bottom nHe = 1, 2 and, 3 × 1021 cm-3, T = 8000 K). The corresponding sum of Lorentzian profiles for nHe = 1 and, 2 × 1021 cm-3 is overplotted (blue lines).
Current usage metrics show cumulative count of Article Views (full-text article views including HTML views, PDF and ePub downloads, according to the available data) and Abstracts Views on Vision4Press platform.
Data correspond to usage on the plateform after 2015. The current usage metrics is available 48-96 hours after online publication and is updated daily on week days.
Initial download of the metrics may take a while.