Fig. 5
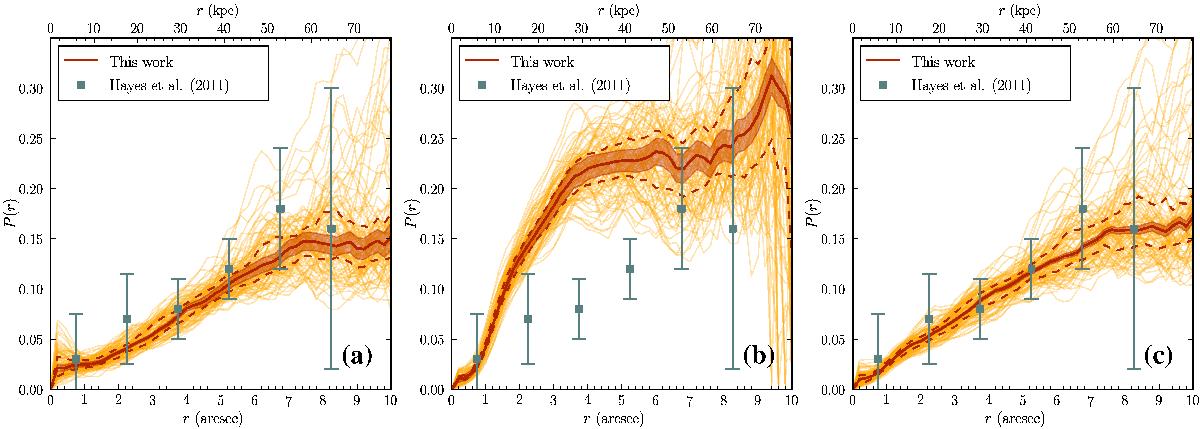
Polarization radial profiles for a) extragalactic emission; b) galactic emission; and c) the overall Lyα emission. The thin orange lines show the profile corresponding to each LOS; the solid red line is the median profile; the dispersion along different LOS is represented by the two dashed red lines (first and third quartiles). The red area shows the 3σ confidence limits inferred from our bootstrap experiment (see Appendix B). The data points are taken from H11.
Current usage metrics show cumulative count of Article Views (full-text article views including HTML views, PDF and ePub downloads, according to the available data) and Abstracts Views on Vision4Press platform.
Data correspond to usage on the plateform after 2015. The current usage metrics is available 48-96 hours after online publication and is updated daily on week days.
Initial download of the metrics may take a while.