Fig. D.1
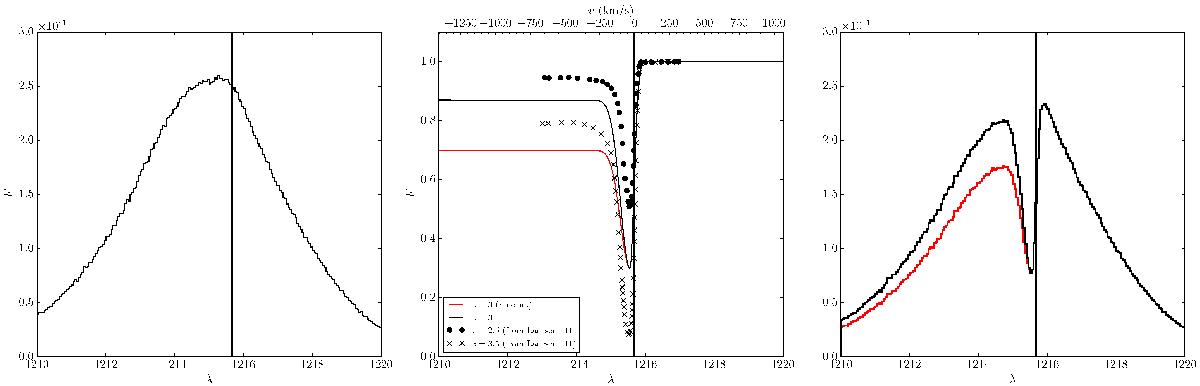
Left: angle-averaged integrated spectrum of our blob (in black), divided into an extragalactic component (in red) and galactic emission (in blue). Middle: IGM transmission function from Rvir to the observer, fitting the results of Laursen et al. at z = 2.5 (dotted line), z = 3 (solid line) and z = 3.5 (dashed line). Right: resulting spectrum after transmission through the IGM. For all three panels, the vertical line denotes the Lyα wavelength.
Current usage metrics show cumulative count of Article Views (full-text article views including HTML views, PDF and ePub downloads, according to the available data) and Abstracts Views on Vision4Press platform.
Data correspond to usage on the plateform after 2015. The current usage metrics is available 48-96 hours after online publication and is updated daily on week days.
Initial download of the metrics may take a while.