Fig. B.1
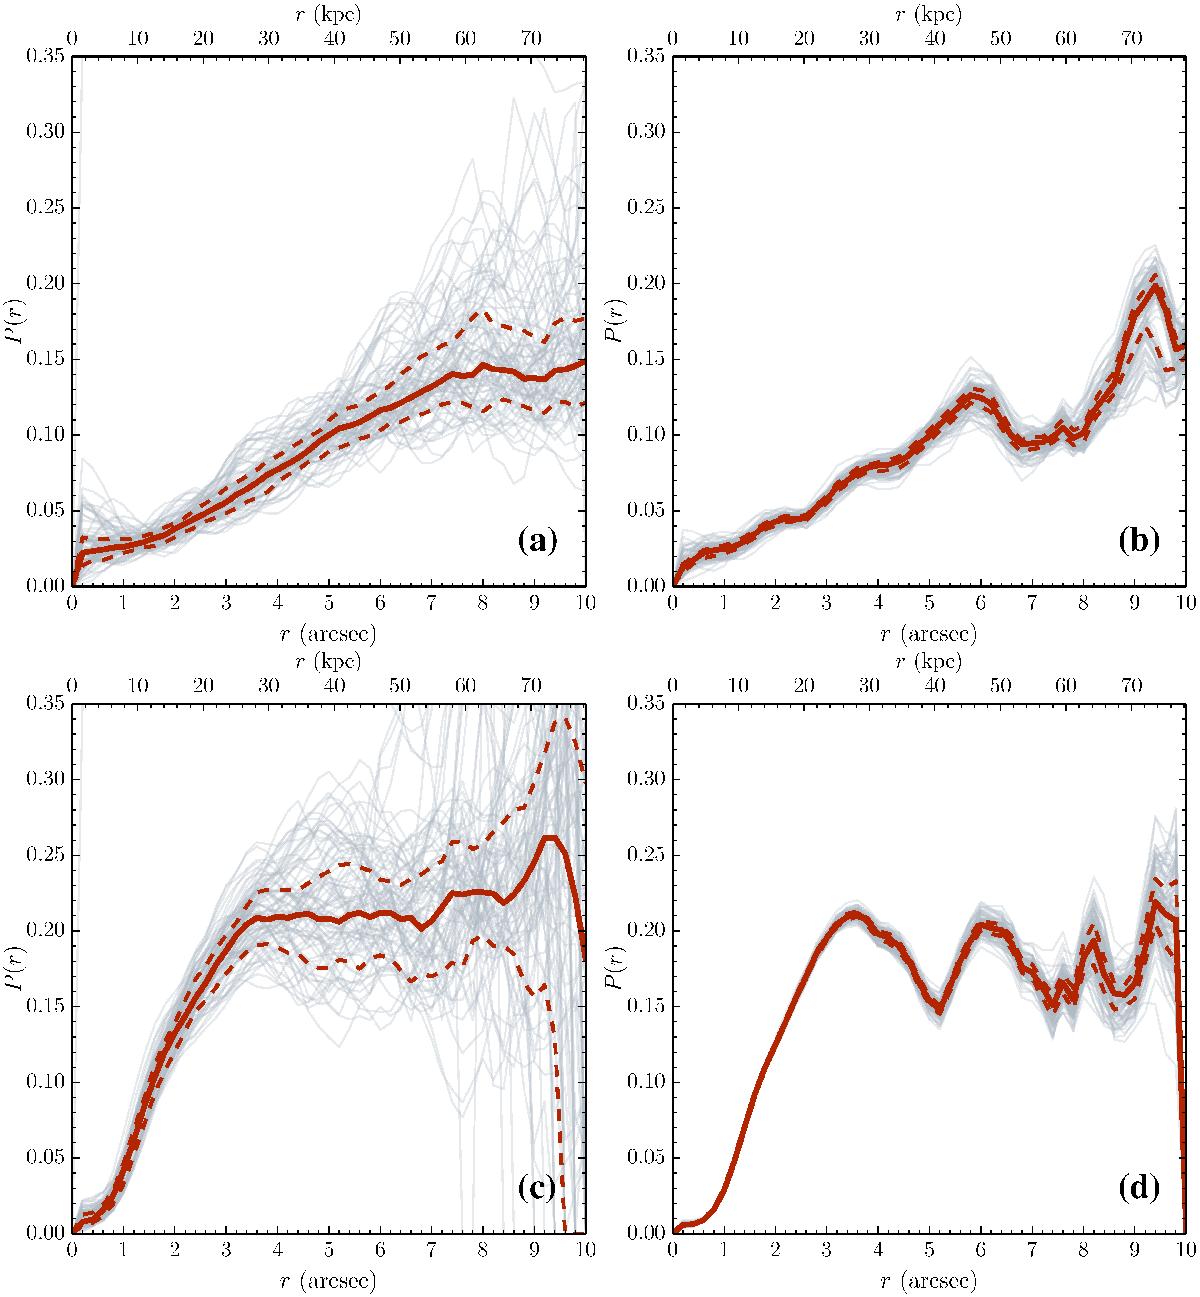
Polarization profile for different subsets of photons. In all the plots, the red solid line is the median profile; the red dashed lines are the first and third quartiles. The thin grey lines represent the profiles for a) 100 LOS with the same photons subset for the gas emission; b) 100 different photon subsets seen with the same LOS for the gas emission; c) 100 LOS with the same photon subsets for the galactic emission; d) 100 different photon subsets seen with the same LOS for the galactic emission.

Current usage metrics show cumulative count of Article Views (full-text article views including HTML views, PDF and ePub downloads, according to the available data) and Abstracts Views on Vision4Press platform.
Data correspond to usage on the plateform after 2015. The current usage metrics is available 48-96 hours after online publication and is updated daily on week days.
Initial download of the metrics may take a while.