Fig. 2
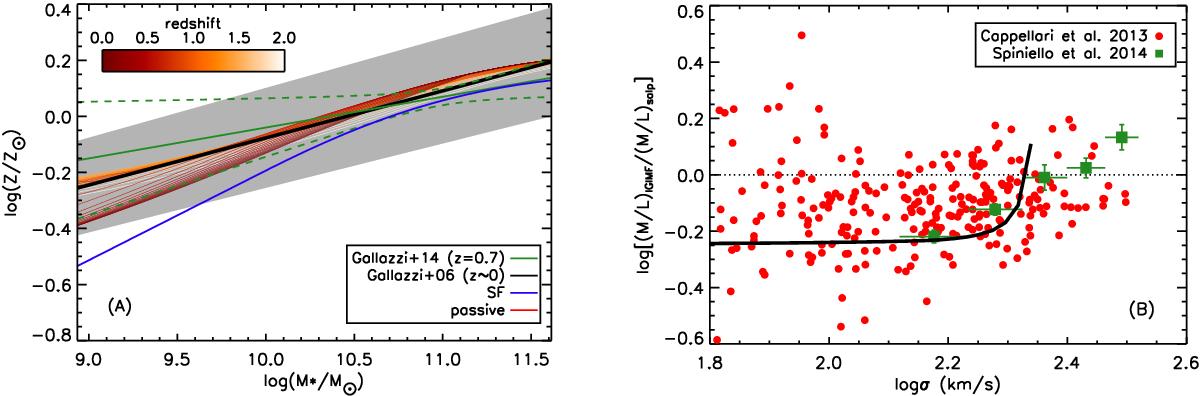
A) Stellar metallicity of ETGs, as a function of M⋆, predicted by our model (orange to red) and observed at z ~ 0 and z ~ 0.7 (Gallazzi et al. 2006, 2014) (black line with gray scatter, and green lines with dashed uncertainty envelope). For comparison, the stellar metallicity of SF galaxies at z = 0 is shown in blue. B) M⋆ to bolometric light ratio (M/L) for z = 0 passive galaxies (solid line), with respect to the Salpeter case (dotted line). The red dots and green squares show, respectively, spectroscopic observations of low-redshift ETGs from Cappellari et al. (2013) and Spiniello et al. (2014). For consistency, we have converted M⋆ into velocity dispersions using Eq. (5) in Cappellari et al. (2013).
Current usage metrics show cumulative count of Article Views (full-text article views including HTML views, PDF and ePub downloads, according to the available data) and Abstracts Views on Vision4Press platform.
Data correspond to usage on the plateform after 2015. The current usage metrics is available 48-96 hours after online publication and is updated daily on week days.
Initial download of the metrics may take a while.