Fig. 1
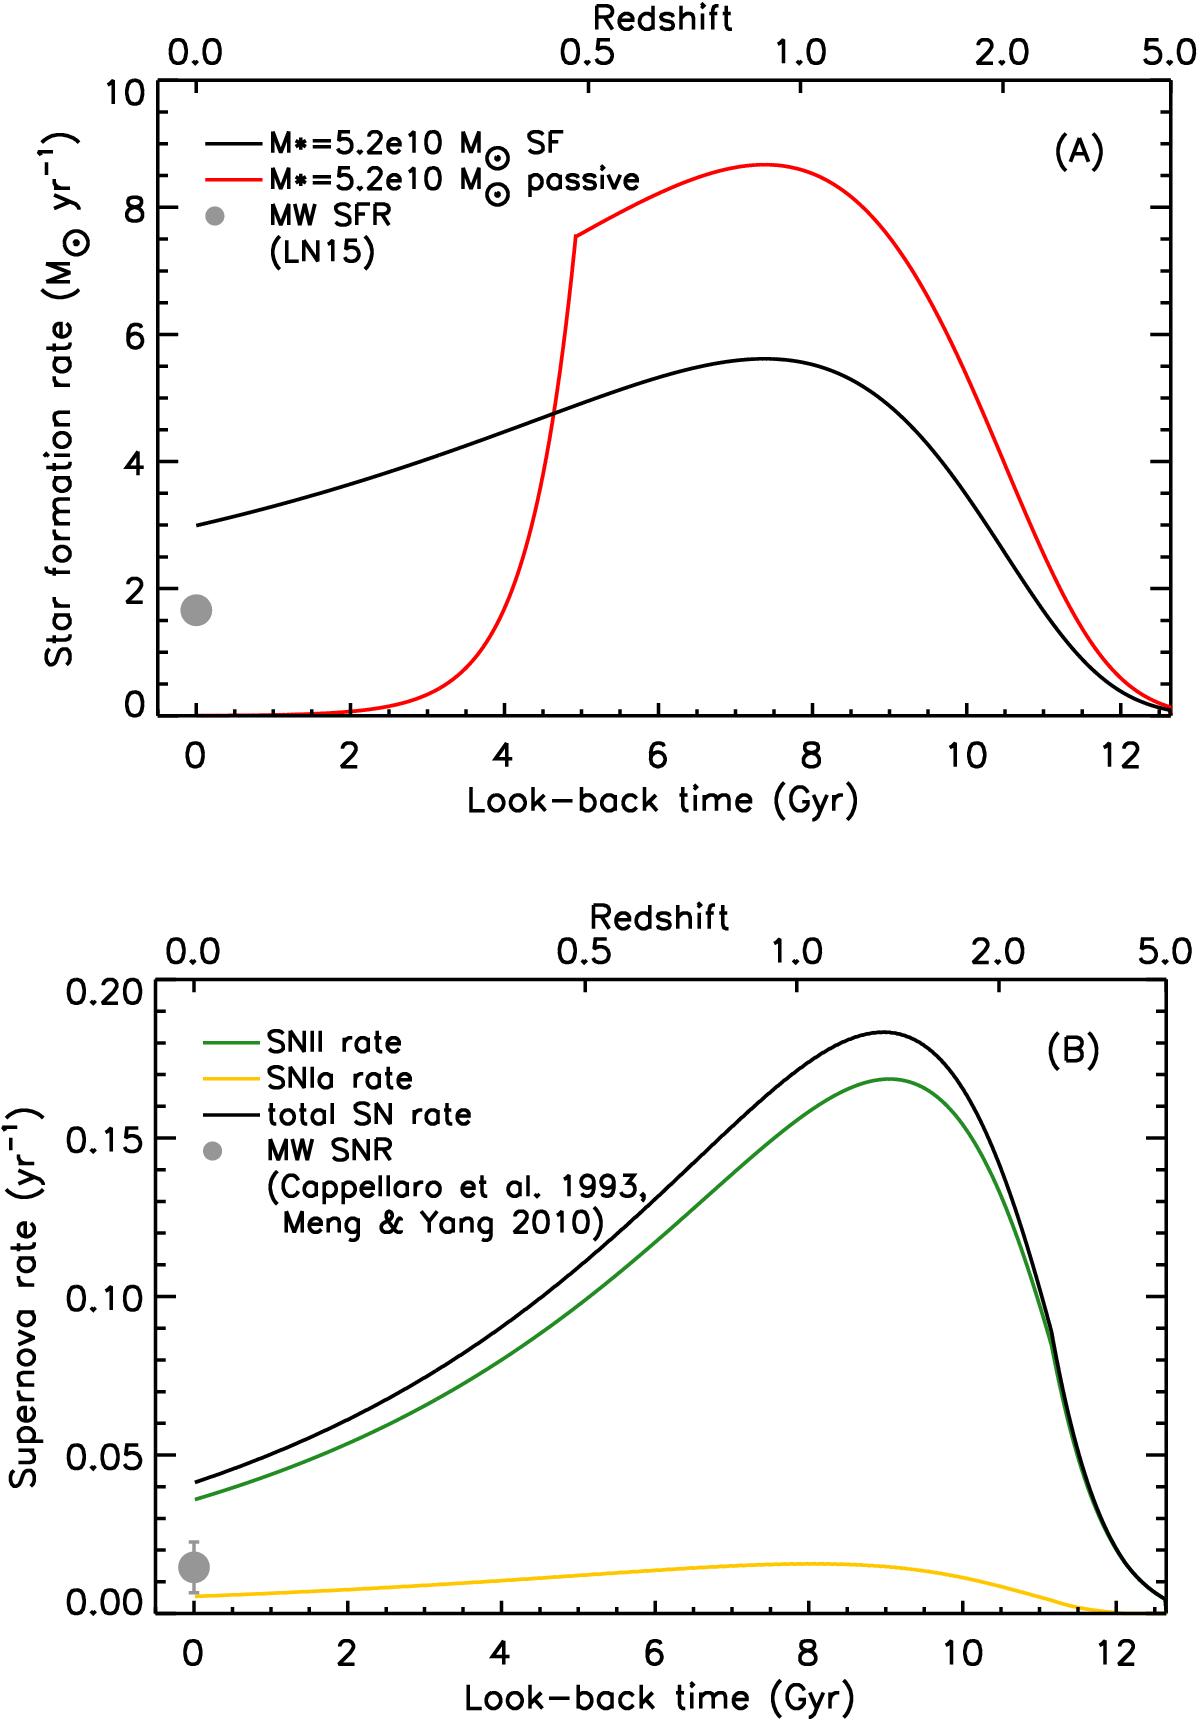
A) SFHs of a passive galaxy quenching at z = 0.4 (red) and a SF galaxy analogous to the MW (black), both having M⋆ = 5.2 × 10¹⁰M⊙. The gray dot shows the estimated SFR of the MW (Licquia & Newman 2015). B) Calculated SNII (green), SNIa (yellow), and total SN rate (black) for the M⋆ = 5.2 × 10¹⁰M⊙ SF galaxy. The estimated MW value is shown as a gray dot (Cappellaro et al. 1993; Meng & Yang 2010).
Current usage metrics show cumulative count of Article Views (full-text article views including HTML views, PDF and ePub downloads, according to the available data) and Abstracts Views on Vision4Press platform.
Data correspond to usage on the plateform after 2015. The current usage metrics is available 48-96 hours after online publication and is updated daily on week days.
Initial download of the metrics may take a while.