| Issue |
A&A
Volume 591, July 2016
|
|
|---|---|---|
| Article Number | L4 | |
| Number of page(s) | 4 | |
| Section | Letters | |
| DOI | https://doi.org/10.1051/0004-6361/201628736 | |
| Published online | 13 June 2016 | |
The fraction of BL Lacertae objects in groups of galaxies
Observatorio Astronómico de Córdoba (UNC) and Instituto de Astronomía Teórica y Experimetal (CONICET-UNC), Córdoba, Argentina
e-mail: hernan@oac.unc.edu.ar
Received: 18 April 2016
Accepted: 18 May 2016
Context. BL Lac objects are a rare class of active galactic nuclei that typically show featureless optical spectra that make it difficult to estimate the redshift. A novel method for estimating the redshift of BL Lac objects has recently been proposed which assumes that these objects typically reside in groups of galaxies.
Aims. The aim of this work is to estimate the fraction of BL Lac objects that reside in groups of galaxies.
Methods. We use a sample of groups (M12 catalogue) selected by applying a friends-of-friends algorithm in the SDSS DR12. Galaxies in the M12 sample were cross-correlated with the sample of blazars in the BZCAT. We found that 121 galaxies in the M12 catalogue are blazars in the BZCAT sample, all but one are BL Lac objects, and a large fraction are classified as BL Lac-galaxy dominated.
Results. Analysing the fraction of galaxies in groups as a function of redshift we have estimated a correction factor that takes into account the typical incompleteness of the catalogues based on the friends-of-friends algorithm. Once this factor was applied to the sample of BL Lac objects with a counterpart in the M12 catalogue, we found that the percentage of BL Lac objects in groups is ≳ 67 ± 8%.
Conclusions. The high rate of BL Lac objects in groups found in this work strongly supports a recent method that has successfully estimated the redshift of BL Lac objects with featureless spectra.
Key words: BL Lacertae objects: general / galaxies: groups: general
© ESO, 2016
1. Introduction
A blazar is a type of active galactic nucleus (AGN) typically associated with elliptical galaxies (Falomo 1996). Blazars are one of the most energetic phenomena in the universe. BL Lac objects are a very specific subtype of blazar that show a rapid and large-amplitude flux variability and have radio-loud AGNs. According to the unified scheme for AGNs (Antonucci 1993; Urry & Padovani 1995), the strong emission of BL Lac objects is interpreted as the result of a relativistic jet aligned with the line of sight of the observer. BL Lac objects are of great interest to the high-energy astrophysics community since they have a great potential to constrain the models for the extragalactic background light (EBL).
A significant fraction of BL Lac objects have featureless spectra, which makes it difficult or impossible to estimate the redshift of the host galaxy. Approximately 50% of the known BL Lac objects do not have redshift estimates. Muriel et al. (2015) have proposed a novel method for estimating the redshift of BL Lac objects. Under the assumption that these AGNs are hosted by early-type galaxies and that these in turn tend to live in systems of galaxies, they have proposed to study the environment of BL Lac objects in order to find their host group/cluster of galaxies. The method was first applied to PKS 0447-439 where these authors found a group of galaxies with at least seven members at z = 0.343 and estimated a probability of ≥97% that the host galaxy of PKS 0447-439 was a member of this group. The same method has been applied by Rovero et al. (2016) to PKS 1424+240, who have found a group of eight or more members at a redshift of 0.0601 and a probability of ≥98% that this group hosts this BL Lac. The proposed redshift of ~0.6 for PKS 1424+240 found by Rovero et al. (2016) is consistent with other methods used to constrain the redshift of this BL Lac. Modelling the change produced by the EBL from high to very high energy in the spectral index of this BL Lac object, Acciari et al. (2010) have found for PKS 1424+240 an upper limit of z< 0.66 (see also Aleksić et al. 2014; Yan & Zhang 2015; Yan et al. 2015). By analysing the Ly β and Ly γ absorption in the far UV, Furniss et al. (2013) have found a lower limit of z> 0.6035 for the same object. The high consistency between these upper and lower limits with the redshift found by Rovero et al. (2016) strongly supports the method proposed by Muriel et al. (2015).
Even in the case that only one group of galaxies is found in the line of sight of a given BL Lac object, the technique applied by Muriel et al. (2015) and Rovero et al. (2016) requires an estimate of the probability that a BL Lac object is in a group of galaxies. These authors estimated that at least 2/3 of the BL Lac objects are in systems of galaxies, but currently there is no accurate estimate of this fraction. During the nineties, several studies addressed the environment of BL Lac objects. Wurtz et al. (1993) studied the environment around five BL Lac objects and found evidence of rich clusters or groups of galaxies around four of them. Using both imaging and spectroscopy, Pesce et al. (1994) found an environment around four BL Lac objects similar to that of Abell clusters of richness class 0. Similar results were found by Smith et al. (1995). Based on images from the Hubble Space Telescope, Pesce et al. (2002) found, for a deep sample of BL Lac objects, that the environment of this type of AGN tends to show a galaxy enhancement over the background. Nevertheless, for some of the objects in their sample, they also found possible evidence that some BL Lac objects can be truly isolated. A group/cluster environment has been reported around individual BL Lac objects (Lietzen et al. 2008). Owing to both the small size of the samples and the limitations of the techniques used to characterize the environment of BL Lac objects, it is quite difficult to make a reliable prediction of the fraction of BL Lac objects that inhabit groups/clusters of galaxies.
Using a large sample of groups of galaxies, in this paper we cross-correlate single galaxies and group members with a large compilation of blazars. The aim of this work is to obtain a precise estimate of the fraction of BL Lac objects that inhabit systems of galaxies. This paper is organized as follows: in Sect. 2 we describe the sample of groups and blazars used to cross-correlate; the results of this analysis are presented in Sect. 3, including the procedure applied to correct for incompleteness; conclusions are presented in Sect. 4. Distances have been computed assuming a flat cosmological model with parameters H0 = 100 h km s-1 Mpc-1, Ω0 = 0.3, and ΩΛ = 0.7.
2. Sample
2.1. Groups of galaxies
We use an updated version of the catalogue of groups of galaxies obtained by Merchán & Zandivarez (2005) using the SDSS. The original catalogue was based on the Third Data Release (DR3, Abazajian et al. 2005), while the new version compiles galaxies and groups in the DR12 (Alam et al. 2015). Despite the difference in the source catalogue, the new sample was compiled (by Merchán, priv. comm., hereafter M12) by applying the same procedure described in Merchán & Zandivarez (2005). Group identification is based on the friends-of-friends (FOF) algorithm developed by Huchra & Geller (1982), which takes into account the density variation produced by the apparent magnitude limit of redshift surveys. The method sets two linking lengths, one in the line of sight (V0R) and one perpendicular to the plane of the sky (D0R), where R is the scaling factor. The value of D0 is chosen to obtain a certain overdensity δρ/ρ. M12 includes two samples of groups of galaxies corresponding to overdensities of 80 and 200, respectively. In order to minimize the number of spurious groups, we use the catalogue corresponding to a δρ/ρ = 200. For more details of the method, see Merchán & Zandivarez (2005). Those galaxies that are not in pairs or groups (number of members ≥3) are also included in the M12 catalogue as single galaxies, i.e. M12 lists all the DR12 galaxies in the redshift range 0.01 ≤ z ≤ 0.3. The number of single galaxies, pairs, and groups are 344732, 54373, and 31649, respectively.
2.2. Blazars
We use the 5th edition of the Roma-BZCAT Catalog of Blazars (BZCAT, Massaro et al. 2015). The catalogue includes coordinates and multifrequency data for 3561 objects. The BZCAT includes a source classification and all have radio band detection, which means that radio quiet BL Lac objects are not included. Blazers are classified as BL Lac and BL Lac candidates, BL Lac-galaxy dominated (with significant emission of the host galaxy over the nuclear emission), QSO radio loud with flat spectrum, and blazars of uncertain classification. Even though we are interested in BL Lac objects, we have considered all the sources in the BZCAT. Owing to the featureless optical spectrum, many BL Lac objects have no redshift determination. Nevertheless, 748 (52%) of the 1425 blazars classified as BL Lac, BL Lac-candidate, or BL Lac-galaxy dominated in the BZCAT have spectroscopic redshift determinations.
Although the sample of blazars is deeper than the group catalogue, there are many blazars in the common redshift region. Figure 1 shows the redshift distribution of both blazars with redshift in the BZCAT and groups of galaxies with three or more members in the M12 catalogue.
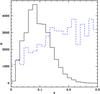 |
Fig. 1 Redshift distribution of groups of galaxies (solid line) and for blazars in the BZCAT (blue dashed line). The numbers in the Y-axes correspond to the groups of galaxies; the number of blazars has been multiplied by 100 to allow a better comparison. |
3. Blazars in groups of galaxies
Although the sample of blazars in the BZCAT is not complete in any sense, objects were not selected based on their environment. Consequently, the cross-correlation between blazars and groups of galaxies is free of selection bias. Several authors cross-correlated samples of blazars with optical sources in the SDSS (Collinge et al. 2005; Turriziani et al. 2007; Massaro et al. 2014). In this work, we do not attempt to identify new BL Lac objects in the SDSS survey, nevertheless, since the BZCAT does not include the SDSS counterpart, a cross-identification is required. The position accuracy of the BZCAT is typically <1′′, but it could be of the order of 5′′ (Massaro et al. 2014). Using a linking length of 5′′, we cross-correlate all the galaxies and blazars in the M12 and the BZCAT, respectively. We found 121 galaxies in the M12 that have a counterpart in the BZCAT. We compared the redshifts in both catalogues and confirmed that they correspond to the same objects. Fifty-five (45 ± 4%) of these galaxies appear as single galaxies in the M12 catalogue (no companion galaxy according to the linking lengths of the FOF algorithm), 27 are in pairs, and 39 are in groups (three or more members). According to the type classification of Massaro et al. (2014), we found, as expected, that most identifications correspond to BL Lac-galaxy dominated objects (96); the remaining blazars are BL Lac (24) and blazar uncertain type (1). Consequently, hereafter we refer to our sample as BL Lac objects. The lower panel of Fig. 2 shows the BL Lac objects with a counterpart in the M12 catalogue. The continuous line shows all the coincidences, and the dashed line corresponds to BL Lac objects in groups. As can be seen, the fraction of BL Lac objects in groups decreases with redshift and, moreover, there are no BL Lac objects in groups beyond z ~ 0.23. This is due to the growth of incompleteness as a function of redshift that the FOF algorithm presents. This can be clearly seen in the upper panel of Fig. 2, where the same effect is present when galaxies in general are considered. In a first attempt to deal with this incompleteness, we have restricted our analysis to BL Lac objects and galaxies with z ≤ 0.2. In this case, the total number of coincidences is 78, of which 25 correspond to single galaxies and 36 are in groups.
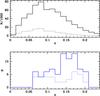 |
Fig. 2 Upper panel: redshift distribution of galaxies in the M12 catalogue (continuous line). The dotted line shows the redshift distribution of galaxies that are in groups of three or more members. Lower panel: as in the upper panel for BL Lac objects in the M12 catalogue. |
In addition to the incompleteness discussed in the previous paragraph, there is another systematic effect that must be considered before computing the fraction of BL Lac objects that reside in groups. Owing to peculiar velocities, catalogues of groups of galaxies identified in redshift space tend to include a fraction of spurious groups. Merchán & Zandivarez (2002) used a set of mock catalogues constructed from numerical simulations to estimate the fraction of spurious groups that arise when a FOF algorithm is applied. They found that approximately 6% of groups with four or more members and 13% of triplets are spurious. In order to account for this effect, we implemented a set of Monte Carlo simulations to compute the fraction of BL Lac in groups of galaxies. Using the bootstrap resampling technique we selected 1000 samples of groups excluding at random the expected fraction of spurious groups. With this procedure, we found that the percentage of BL Lac in groups of galaxies is 43 ± 5%. We note that this value was obtained by disregarding the effect of incompleteness that also affects the identification of groups of galaxies in the redshift space. Merchán & Zandivarez (2002) found that this incompleteness is at least 10%. Moreover, the incompleteness grows with redshift. Evidence of this is the fact that, when we restrict our analysis to z ≤ 0.1, the percentage of BL Lac objects in groups grows to 78 ± 12%. Figure 1 clearly shows that the number density of groups of galaxies begins to fall at redshift ~0.07 and few groups are identified at redshift >0.2. Assuming that this incompleteness equally affects galaxies and BL Lac objects, we have selected a random sample of galaxies from the M12 catalogue that have the same redshift distribution of BL Lac objects with a counterpart in the M12. For this random sample, we found that the fraction of galaxies in groups is 19.3 ± 0.1%, much smaller than the 43% found for BL Lac objects in groups. This result clearly shows that this type of AGN has a higher probability of being in groups than galaxies in general.
The small number of BL Lac objects with a counterpart in the M12 catalogue does not permit the fraction of BL Lac objects in groups as a function of redshift to be appropriately tested. Nevertheless, we can quantify the consequences of the incompleteness by using galaxies in the M12 catalogue. The procedure is the following: we compute the fraction of galaxies in the M12 catalogue as a function of redshift in bins of Δz = 0.015. Table 1 shows that the percentage of galaxies in groups decreases with redshift from ~30% at low redshift (PerLow z) to 11.3% for z = 0.2. In this context, the percentage reported of 19.3% (Per0.0 ≤ z ≤ 0.2) of galaxies in groups in the redshift range 0 ≤ z ≤ 0.2 would be the average of these two values. Assuming that the sample of groups in the M12 catalogue is complete at low redshift and that the fraction of galaxies that belong to groups does not depend on redshift, we can correct the percentage of galaxies in groups up to z = 0.2 as
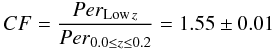
(the uncertainty was estimated by error propagation). If we apply this correction factor to the observed fraction of BL Lac objects in groups, we find that the expected percentage of BL Lac objects in groups is ~67 ± 8% (the uncertainty was estimated by error propagation). Considering that even the sample of groups at low redshift used to compute CF may be incomplete, this value should be taken as a lower limit. We note that the percentage is consistent with the 78 ± 12% found when restricting our analysis to z ≤ 0.1; however, this number was obtained with only 13 objects.
Fraction of galaxies in groups as a function of redshift in the M12 catalogue.
4. Conclusions
Using a large sample of groups of galaxies, we estimated the percentage of BL Lac objects that are in groups. The sample of groups was selected by Merchan 2015 (M12), applying a friends-of-friends algorithm in the SDSS-DR12. Those galaxies in the SDSS-DR12 that are not in pairs or groups are also included in the M12 sample as single galaxies. Galaxies in the M12 sample were cross-correlated with the sample of blazars in the BZCAT of Massaro et al. (2015). We found that 121 galaxies in the M12 catalogue are blazars in the BZCAT sample. According to Massaro et al. (2015), these blazars have been classified as BL Lac-galaxy dominated (96), BL Lac (24), and blazar uncertain type (1).
Since the sample of groups of galaxies is highly incomplete beyond z ~ 0.2, we have restricted the analysis to this redshift. In this case, the number of coincidences between the two catalogues is 78. Once contamination by spurious groups is taken into account, 32 ± 4% of the BL Lac objects correspond to single galaxies and 43 ± 5% are in groups of three or more members. For a random sample of galaxies with the same redshift distribution, the percentage of galaxies in groups is 19.3 ± 0.1%. Since samples of groups of galaxies selected using FOF algorithms have a growing incompleteness with redshift, the number of BL Lac/galaxies in groups should be taken as lower limits. By analysing the fraction of galaxies in groups as a function of redshift, we estimated a correction factor that takes into account the incompleteness of the group catalogue. Once this factor is applied to the sample of 78 BL Lac objects with counterpart in the M12 catalogue, we conclude that the percentage of BL Lac objects in groups is ≳67 ± 8%. Although this result corresponds mainly to BL Lac-galaxy dominated objects and in the nearby Universe, we see no reason why this result cannot be extended to higher redshift or BL Lac objects in general. Interestingly, this fraction is similar to the value found for FR I galaxies in almost the same redshift range. Zirbel (1997) found that about 70% of FR I galaxies at z< 0.25 reside in overdense environments while this is much less frequently the case for FR II galaxies that are believed to be the parent population of flat-spectrum radio loud quasars (see Castignani et al. 2014 and Malavasi et al. 2015 for high redshift objects).
The high rate of BL Lac objects in groups found in this work strongly supports the method proposed by Muriel et al. (2015) and successfully used by Rovero et al. (2016).
Acknowledgments
We thank the anonymous referee for useful questions and suggestions that improved this paper. This work has been partially supported with grants from the Consejo Nacional de Investigaciones Científicas y Técnicas de la República Argentina (CONICET) and the Secretaría de Ciencia y Tecnología de la Universidad de Córdoba. We thank M. Merchán for making publicly available the catalogue of groups of galaxies. Funding for the Sloan Digital Sky Survey (SDSS) was provided by the Alfred P. Sloan Foundation, the Participating Institutions, the National Aeronautics and Space Administration, the National Science Foundation, the US Department of Energy, the Japanese Monbukagakusho, and the Max Planck Society. The SDSS Web site is http://www.sdss.org/. The SDSS is managed by the Astrophysical Research Consortium (ARC) for the Participating Institutions. The Participating Institutions are the University of Chicago, Fermilab, the Institute for Advanced Study, the Japan Participation Group, Johns Hopkins University, the Korean Scientist Group, Los Alamos National Laboratory, the Max Planck Institut für Astronomie (MPIA), the Max Planck Institut für Astrophysik (MPA), New Mexico State University, the University of Pittsburgh, the University of Portsmouth, Princeton University, the United States Naval Observatory, and the University of Washington.
References
- Abazajian, K., Adelman-McCarthy, J. K., Agüeros, M. A., et al. 2005, AJ, 129, 1755 [NASA ADS] [CrossRef] [Google Scholar]
- Acciari, V. A., Aliu, E., Arlen, T., et al. 2010, ApJ, 708, L100 [NASA ADS] [CrossRef] [Google Scholar]
- Alam, S., Albareti, F. D., Allen de Prieto, C., et al. 2015, ApJS, 219, 12 [NASA ADS] [CrossRef] [Google Scholar]
- Aleksić, J., Ansoldi, S., Antonelli, L. A., et al. 2014, A&A, 567, A135 [NASA ADS] [CrossRef] [EDP Sciences] [Google Scholar]
- Antonucci, R. 1993, ARA&A, 31, 473 [Google Scholar]
- Castignani, G., Chiaberge, M., Celotti, A., Norman, C., & De Zotti, G. 2014, ApJ, 792, 114 [NASA ADS] [CrossRef] [Google Scholar]
- Collinge, M. J., Strauss, M. A., Hall, P. B., et al. 2005, AJ, 129, 2542 [NASA ADS] [CrossRef] [Google Scholar]
- Falomo, R. 1996, MNRAS, 283, 241 [NASA ADS] [Google Scholar]
- Furniss, A., Williams, D. A., Danforth, C., et al. 2013, ApJ, 768, L31 [NASA ADS] [CrossRef] [Google Scholar]
- Huchra, J. P., & Geller, M. J. 1982, ApJ, 257, 423 [NASA ADS] [CrossRef] [Google Scholar]
- Lietzen, H., Nilsson, K., Takalo, L. O., et al. 2008, A&A, 482, 771 [NASA ADS] [CrossRef] [EDP Sciences] [Google Scholar]
- Malavasi, N., Bardelli, S., Ciliegi, P., et al. 2015, A&A, 576, A101 [NASA ADS] [CrossRef] [EDP Sciences] [Google Scholar]
- Massaro, F., Masetti, N., D’Abrusco, R., Paggi, A., & Funk, S. 2014, AJ, 148, 66 [NASA ADS] [CrossRef] [Google Scholar]
- Massaro, E., Maselli, A., Leto, C., et al. 2015, Ap&SS, 357, 75 [NASA ADS] [CrossRef] [Google Scholar]
- Merchán, M., & Zandivarez, A. 2002, MNRAS, 335, 216 [NASA ADS] [CrossRef] [Google Scholar]
- Merchán, M. E., & Zandivarez, A. 2005, ApJ, 630, 759 [NASA ADS] [CrossRef] [Google Scholar]
- Muriel, H., Donzelli, C., Rovero, A. C., & Pichel, A. 2015, A&A, 574, A101 [NASA ADS] [CrossRef] [EDP Sciences] [Google Scholar]
- Pesce, J. E., Falomo, R., & Treves, A. 1994, AJ, 107, 494 [NASA ADS] [CrossRef] [Google Scholar]
- Pesce, J. E., Urry, C. M., O’Dowd, M., et al. 2002, New Astron. Rev., 46, 159 [NASA ADS] [CrossRef] [Google Scholar]
- Rovero, A. C., Muriel, H., Donzelli, C., & Pichel, A. 2016, A&A, 589, A6 [NASA ADS] [CrossRef] [EDP Sciences] [Google Scholar]
- Smith, E. P., O’Dea, C. P., & Baum, S. A. 1995, ApJ, 441, 113 [NASA ADS] [CrossRef] [Google Scholar]
- Turriziani, S., Cavazzuti, E., & Giommi, P. 2007, A&A, 472, 699 [NASA ADS] [CrossRef] [EDP Sciences] [Google Scholar]
- Urry, M. C., & Padovani, P. 1995, PASP, 107, 803 [NASA ADS] [CrossRef] [Google Scholar]
- Wurtz, R., Ellingson, E., Stocke, J. T., & Yee, H. K. C. 1993, AJ, 106, 869 [NASA ADS] [CrossRef] [Google Scholar]
- Yan, D., & Zhang, L. 2015, MNRAS, 447, 2810 [NASA ADS] [CrossRef] [Google Scholar]
- Yan, D., Kalashev, O., Zhang, L., & Zhang, S.-N. 2015, MNRAS, 449, 1018 [NASA ADS] [CrossRef] [Google Scholar]
- Zirbel, E. L. 1997, ApJ, 476, 489 [NASA ADS] [CrossRef] [Google Scholar]
All Tables
All Figures
|
Fig. 1 Redshift distribution of groups of galaxies (solid line) and for blazars in the BZCAT (blue dashed line). The numbers in the Y-axes correspond to the groups of galaxies; the number of blazars has been multiplied by 100 to allow a better comparison. |
| In the text | |
|
Fig. 2 Upper panel: redshift distribution of galaxies in the M12 catalogue (continuous line). The dotted line shows the redshift distribution of galaxies that are in groups of three or more members. Lower panel: as in the upper panel for BL Lac objects in the M12 catalogue. |
| In the text | |
Current usage metrics show cumulative count of Article Views (full-text article views including HTML views, PDF and ePub downloads, according to the available data) and Abstracts Views on Vision4Press platform.
Data correspond to usage on the plateform after 2015. The current usage metrics is available 48-96 hours after online publication and is updated daily on week days.
Initial download of the metrics may take a while.