Free Access
Fig. 2
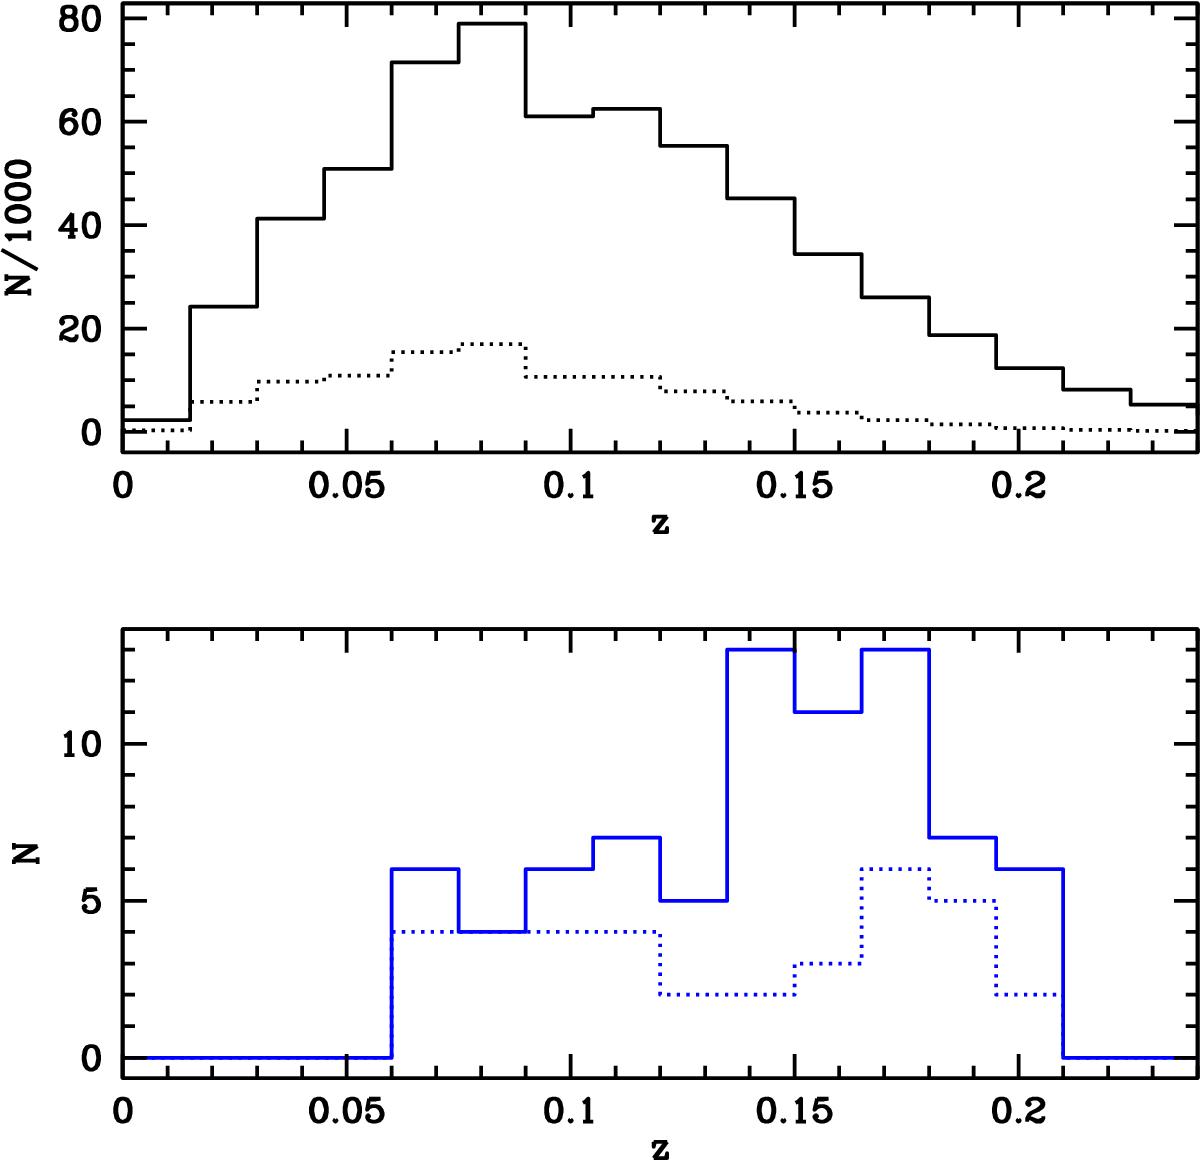
Upper panel: redshift distribution of galaxies in the M12 catalogue (continuous line). The dotted line shows the redshift distribution of galaxies that are in groups of three or more members. Lower panel: as in the upper panel for BL Lac objects in the M12 catalogue.
Current usage metrics show cumulative count of Article Views (full-text article views including HTML views, PDF and ePub downloads, according to the available data) and Abstracts Views on Vision4Press platform.
Data correspond to usage on the plateform after 2015. The current usage metrics is available 48-96 hours after online publication and is updated daily on week days.
Initial download of the metrics may take a while.