Fig. 9
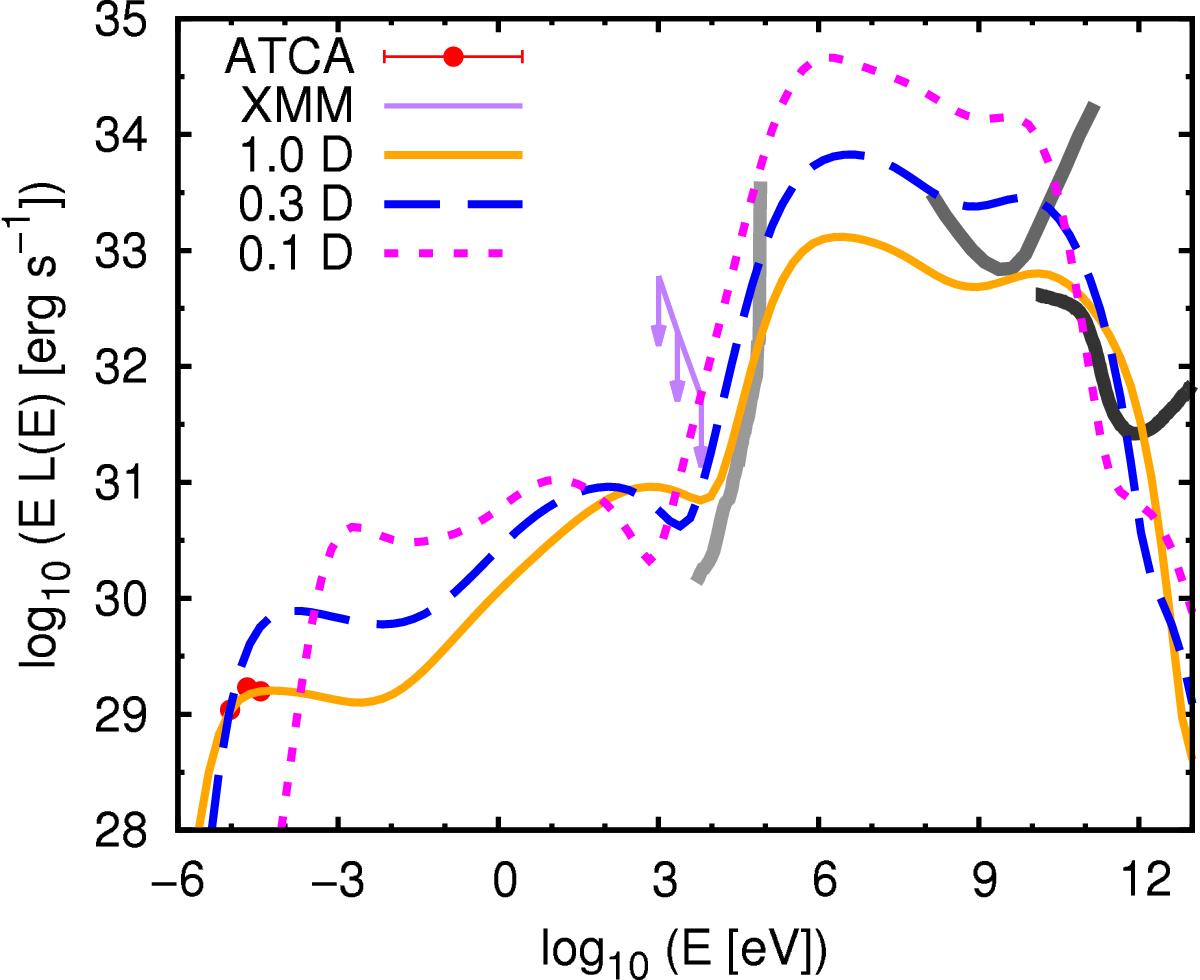
Same as Fig. 6, but considering a possible hardening in the electron distribution. The solid orange curve represents the modeled SED for the epoch of radio observations, the long-dashed blue line is the SED for roughly the present epoch (middle), and the short-dashed magenta line is the SED for roughly the periastron passage.
Current usage metrics show cumulative count of Article Views (full-text article views including HTML views, PDF and ePub downloads, according to the available data) and Abstracts Views on Vision4Press platform.
Data correspond to usage on the plateform after 2015. The current usage metrics is available 48-96 hours after online publication and is updated daily on week days.
Initial download of the metrics may take a while.