Fig. 7
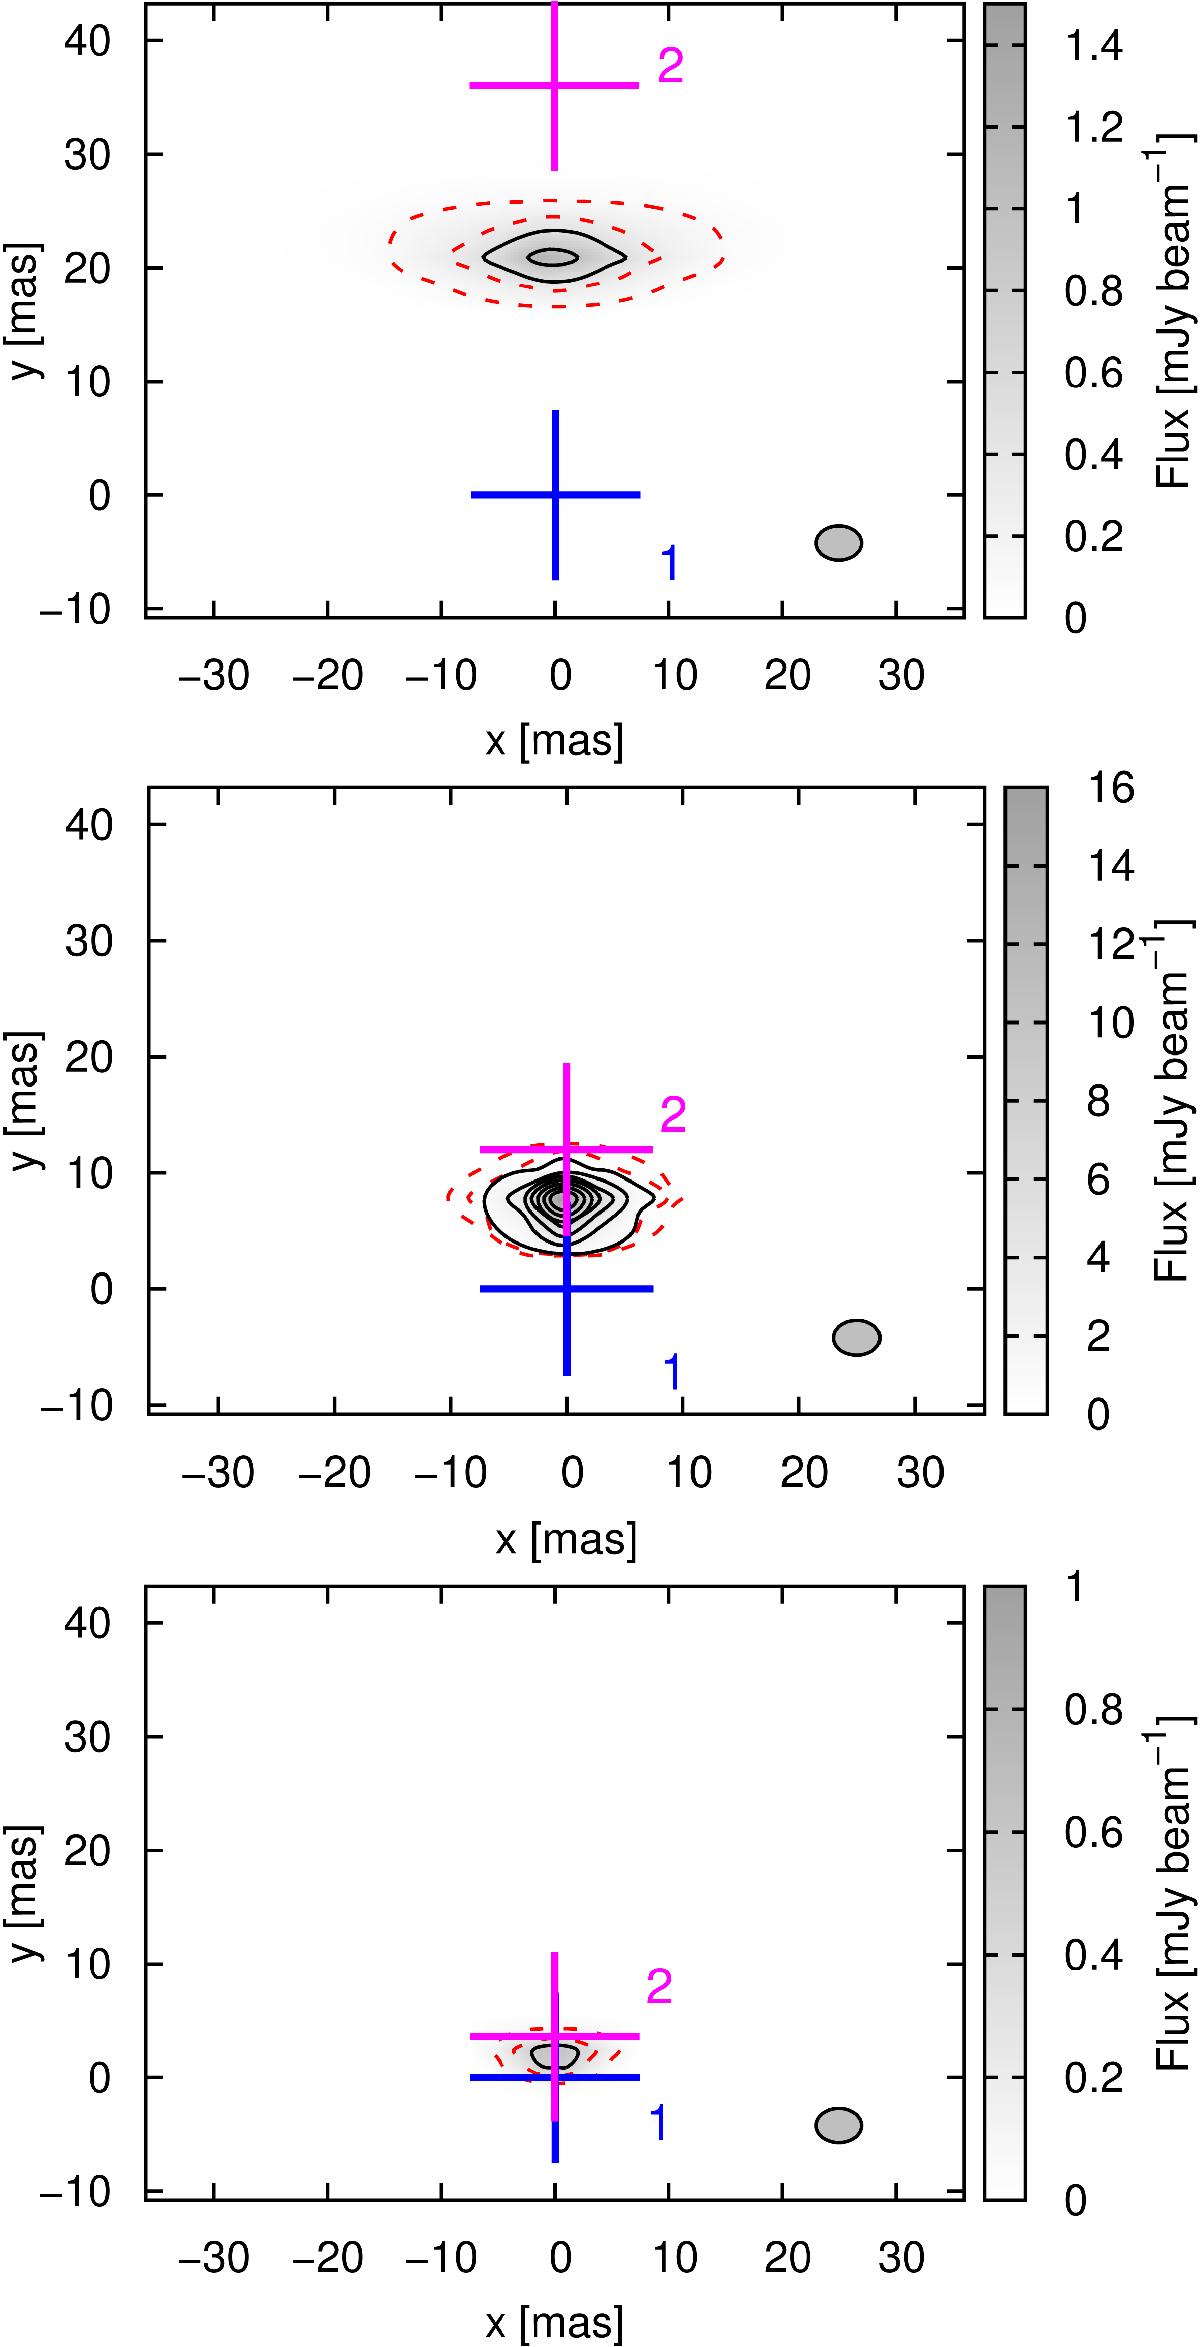
Synthetic radio maps at 8.6 GHz for the same binary separation as in the epoch of the LBA observations (top), for roughly the present epoch (middle), and for roughly the periastron passage (bottom) for the model described in Sect. 3.2. In all images, the red contours are at 0.1 mJy beam-1 and 0.3 mJy beam-1. In the top image the black contours are 0.5 mJy beam-1 and 1.0 mJy beam-1, in the middle image they start at 0.5 mJy beam-1 and increase in 2.0 mJy beam-1, and in the bottom one, there is only one contour at 0.5 mJy beam-1.
Current usage metrics show cumulative count of Article Views (full-text article views including HTML views, PDF and ePub downloads, according to the available data) and Abstracts Views on Vision4Press platform.
Data correspond to usage on the plateform after 2015. The current usage metrics is available 48-96 hours after online publication and is updated daily on week days.
Initial download of the metrics may take a while.